The week started off looking like a Fred Sanford market (70's sitcom reference) -- who famously said, 'this could be the big one!'
Indeed, accelerated selling continuing after two weeks of a slow grind lower despite decent earnings reports. But then it suddenly stopped as Friday turned strong for stocks. Was that it? Did the market dodge what looked to many to be a rather nasty bullet?
Perhaps. The weekly charts give some clues.
Confirmation Needed
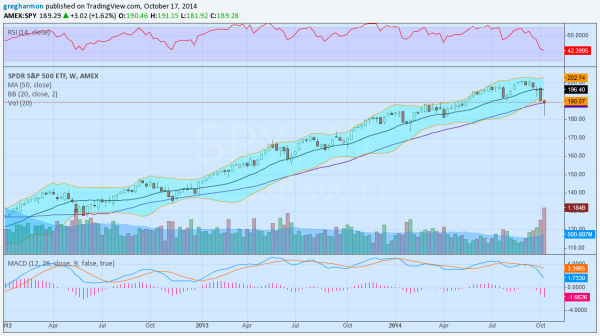
The SPDR S&P 500 (ARCA:SPY) chart above shows a Hammer candle that is sitting on the 50-week moving average. This is a potential reversal candle, but it has to be confirmed higher next week. The momentum indicator, RSI, has held in the bullish zone for now but the other one -- the MACD -- is still pointing at lower prices.
So it's time to spend some time this weekend looking for those stocks you want to own just in case the SPY does not continue higher next week.
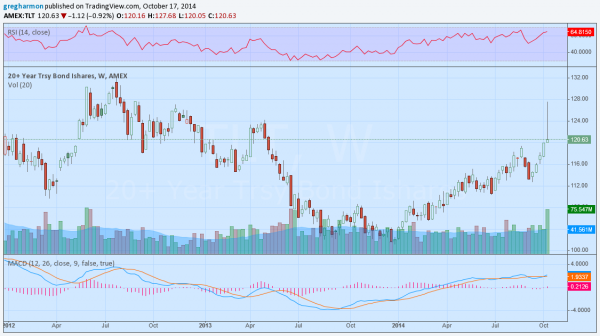
Maybe even more interesting is the chart for the U.S. Treasury Bond ETF (ARCA:TLT). The blow-off top noted early this week looks very ugly on this timeframe. But it, too, needs confirmation by a move lower next week. If it does confirm, that will be another plus for stocks.
But until these things happen it seems best to remain cautious.


