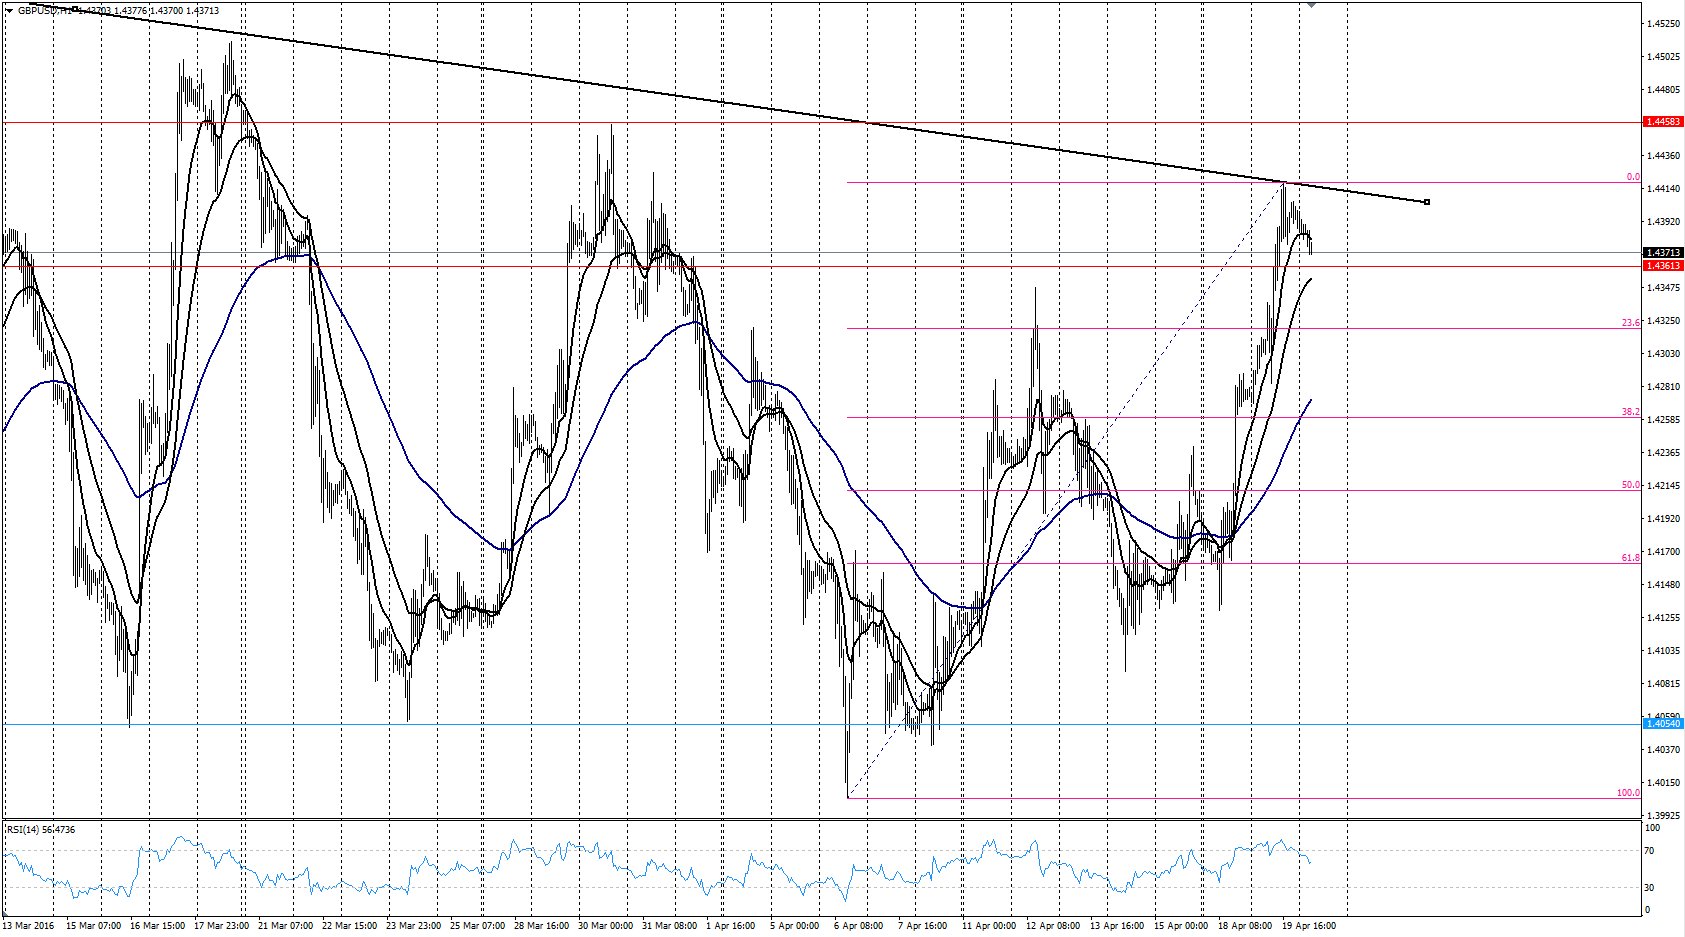
The last few weeks have been relatively strong for the venerable Cable as the pair has continued to be buoyant following a broadly negative streak for the US dollar. However, it appears that some sharp falls could be on the horizon given that a key ABCD pattern has just completed.
Despite the Cable bulls running rampant around the village over the past week, technical indicators are now signalling that a pullback could be looming for the currency pair. Taking a look at the hourly chart shows price action’s recent rampant push towards the top of the bearish channel. Normally, such a bullish push would be welcome given my penchant for Long Cable positions. However, a closer inspection of the hourly chart shows a relatively clear ABCD pattern which commenced in early April and just completed the “D” leg today.
Additionally, the RSI Oscillator is also signalling some bearish moves afoot as the indicator trends steadily lower, away from overbought territory. However, it should be noted that the stochastic oscillator stands in contrast to the recent pullback exhibited in RSI.The 12EMA has also turned, in line with the falling price action, and is now trending lower heading towards a likely bearish cross with the 30 EMA. There is also a relatively clear bearish Gartley pattern whose completion coincides perfectly with the falling trend line.

Subsequently, given the bearish technical indicators, there is plenty of scope for a retracement back towards the 38.2% retracement level around the 1.4190 mark. However, as always with the Cable, relatively wide stops are needed given some of the volatility that is likely to become apparent later in the week. The much watched UK Unemployment and Claimant Count rate is due out shortly and could be a game changer from a fundamental perspective. Therefore, watch those results closely lest they invalidate the technical aspects of this trade.
