Unfortunately, I was not able to provide you with an Elliott Wave Principle (EWP) update on Tesla (NASDAQ:TSLA) as I was out sick, but since my last update on Aug. 20, a lot has happened. Back then, I was looking for higher prices still, but warned downside risk was increasing. Two weeks later and Tesla has – on a split-adjusted basis – gained a “whopping” 3%, with likely more downside in store.
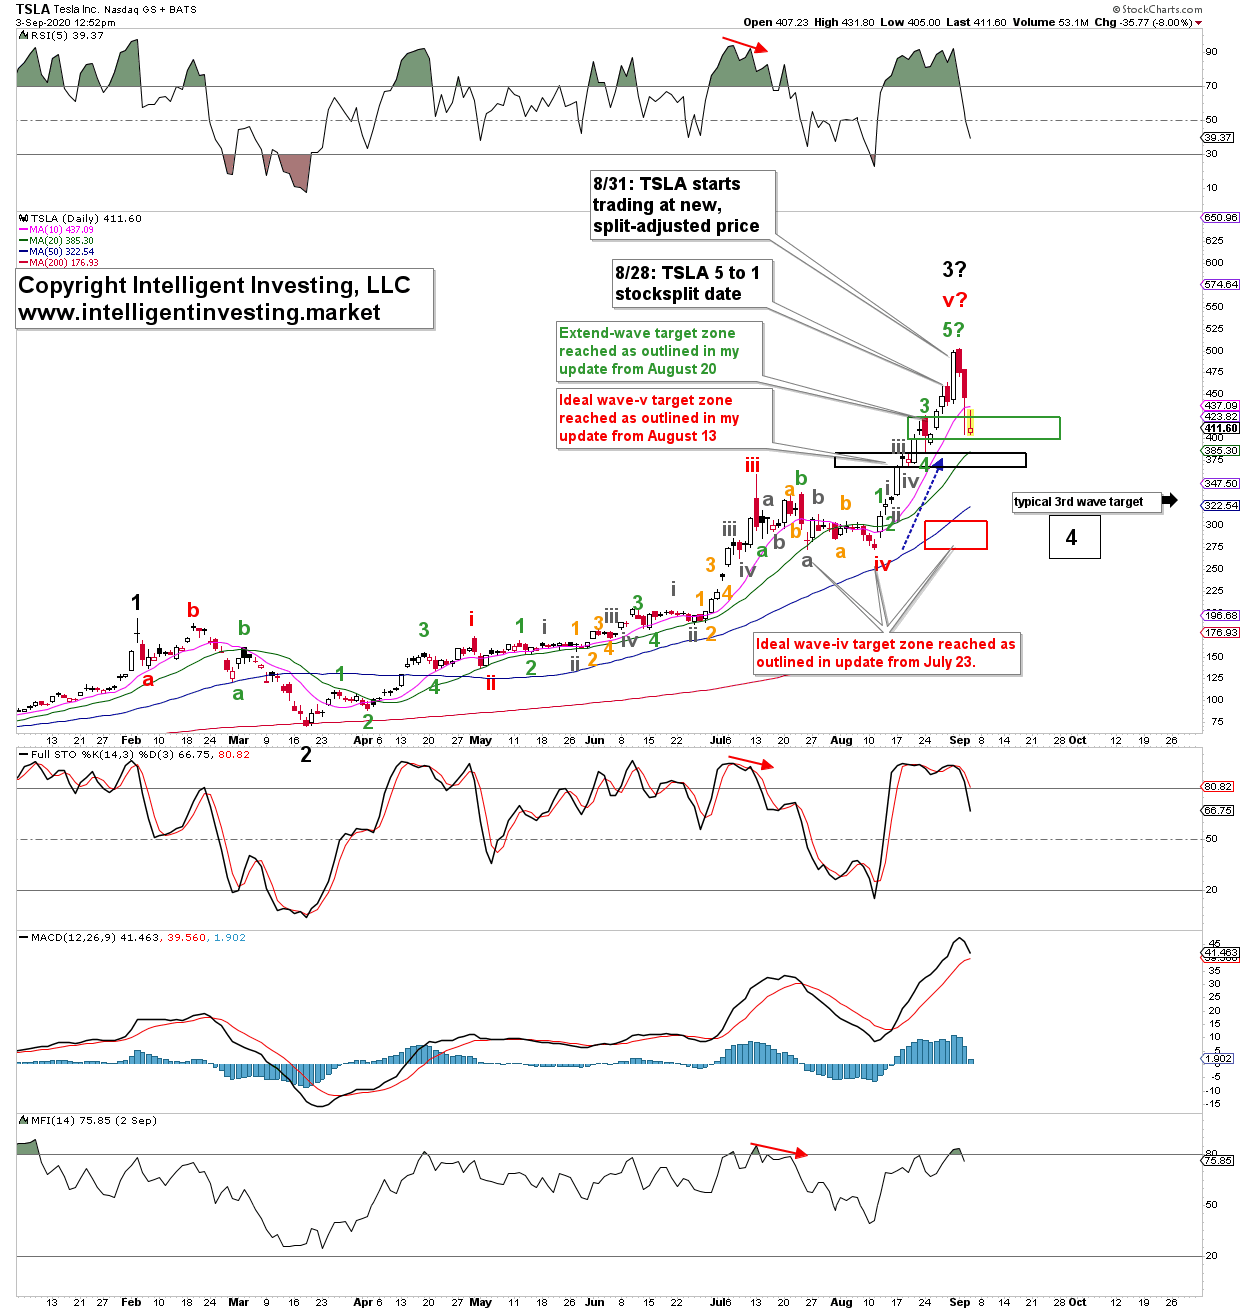
After Tesla had exceeded my first target zone, which was based on the typical/standard wave 5 = wave 1 length (blue arrow and the black box), I found in my last update:
“Tesla should typically top out between the 0.764-1.00x extension of green wave-1: $406-423 [split-adjusted price]. Of course, wave-5 can also extend. Then we have an extension within an extension upon our hands. To be determined.”
See Figure 1 below for the price target zones.
Figure 1, TSLA daily chart:

Well, the stock decided indeed to extend more, which I cannot reasonably foresee but only anticipate, and rallied hard the day after the 5-to-1 stock split, only to give up all those gains. A typical “buy the rumor, sell the news” kind of setup. It is already down 20% since the Sept. 1 all-time-high. Hence, I hope you heeded my warning from my last update “downside risk is increasing.” Anybody who chased that split is now underwater if they did not put any stop-loss orders in place. Word of advice: Every time you enter a trade, the first thing you must do is set a stop loss. Amateurs only think of profits, professionals only think of downside risk. Once you manage that risk, profits will take care of themselves. How did my trade work out, since I was on Aug. 20 “still exposed to Tesla, albeit only 1/8th of a position”? I got stopped out with a 5% trailing stop in place at $402.80. That trade netted me almost $2,500, and which I tweet in real-time on my private twitter trading feed. It allows you to duplicate my trades, skip the downside risk, and let others do the chasing.
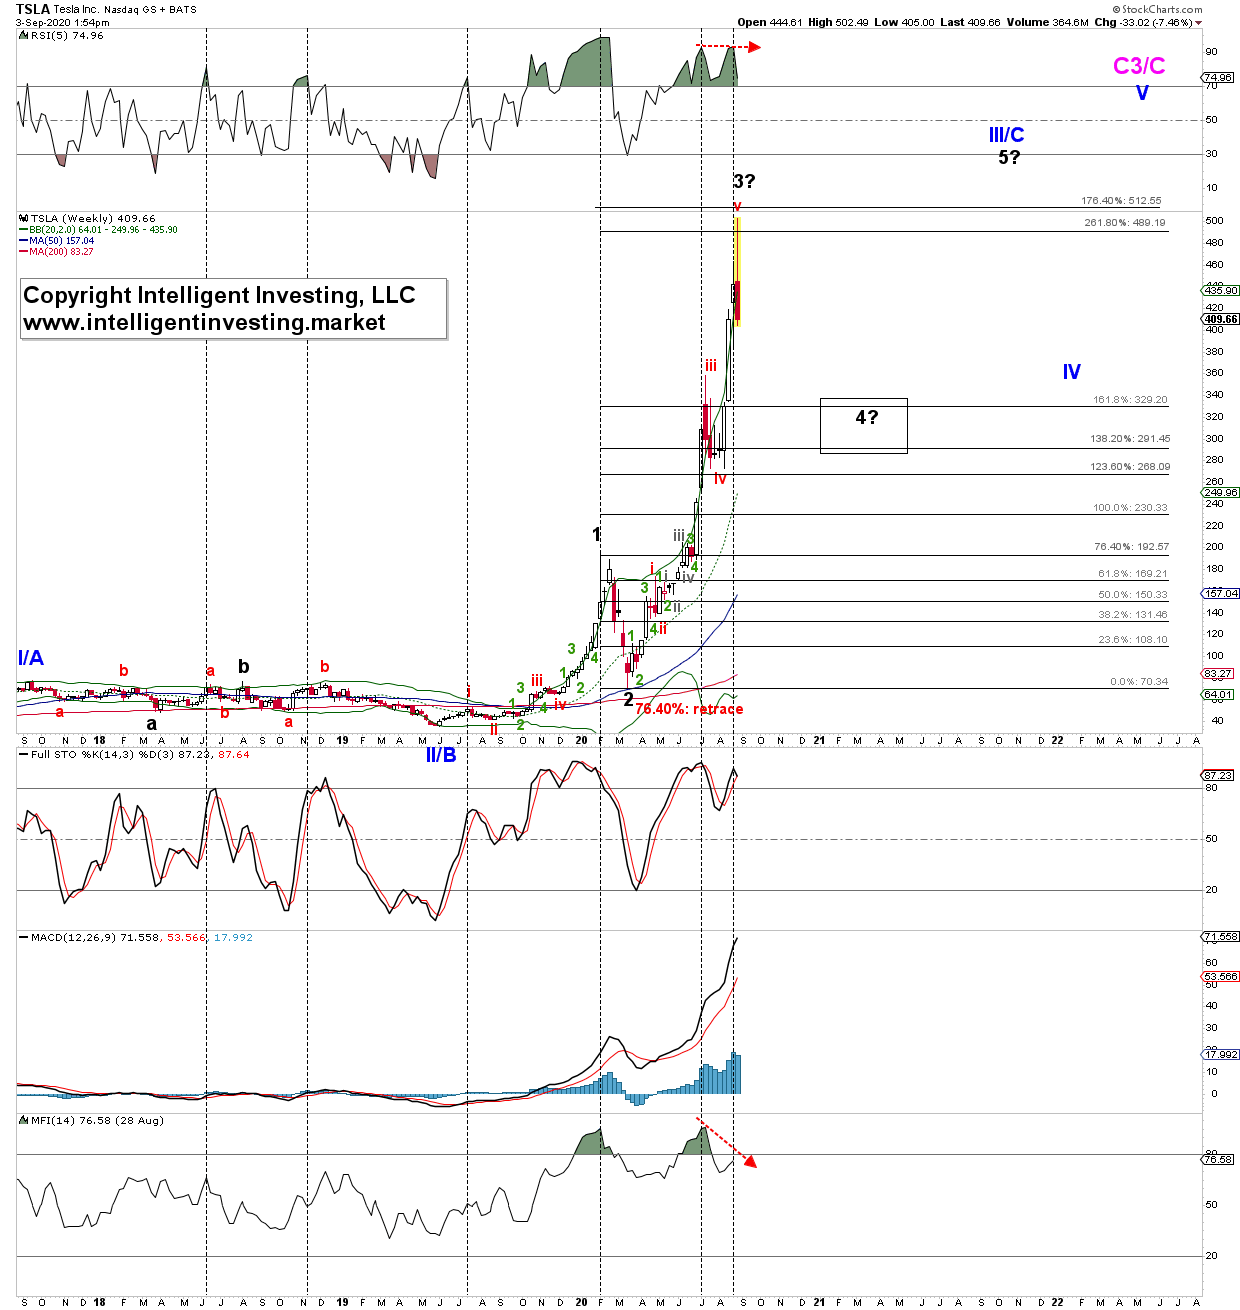
Moving on, my preferred view is that black, major, wave-3 topped, and major wave-4 is now under way. The weekly chart below shows my bigger picture EWP count for this stock. Note how “normally” a 3rd wave should target only the 161.80% Fib-extension. In this case, it went to just north of the 2.618x extension—quite the move. Now, wave-4 should ideally fall back to around $280-340 before wave-5 kicks in. A loss of the $270 level will be a severe warning Tesla has put in a much larger top.
From a technical analysis perspective, the money flow index (MFI14) did not confirm the recent rally (less money flowing into the stock then several weeks ago), and drying liquidity is always a concern for the sustainability of a rally. The stock tends to peak at extreme RSI5 readings (vertical lines) but is firmly above its rising moving average. Thus, it is still in a strong bull market, and from that perspective going through what for now should be considered a healthy correction.
Figure 2, TSLA weekly chart:

Once wave-4 ends, wave-5 should take hold and rally price to ideally the 300% extension at around $550. That should then – ideally – complete (blue) primary III/C. For now, that is as far as I would like to try to see into the future. Let us focus on this wave-4 first, which will be – as most corrections often are – a frustrating period for most traders and investors. I am glad I am out of this stock for now. As long as this week’s high is not exceeded, I prefer to look lower, knowing there will likely be several twists and turns along the way down.
The daily chart (Figure 1) shows the instrument is now below its 10-day Simple Moving Average (SMA), and when that has happened before, more extensive corrections unfolded (black wave-2 and red wave-iv).
