Forex News and Events
To everybody’s astonishment, the RBI lowered the benchmark repo rate by 25 basis points to 7.50% via surprise action in an effort to “compensate the delay in fiscal consolidation” and to comply with PM Modi’s budget announcement (!) While the new budget was rather expected to displease the RBI and keep the bank on hold at least until April 7th scheduled policy meeting, the surprise rate cut was all but expected! To summarize quickly, the PM Modi announced four days ago to include the funding of infrastructure to his first full-year budget and did little to decrease subsidies, meaning that his government is not afraid of widening the deficit to fuel growth. In this picture, the higher government spending and softer fiscal consolidation is upright against the central bank’s price stability mandate (government and the CB agreed to fix the target at 4% +/-2%). There is the surprise effect! While the India’s inflation is ranked third among the leading Asian economies (with January CPI at 5.11% y/y), nobody would have expected Rajan to get positioned in the easy-money camp. Apparently, the low energy environment justifies temporary policy deviations both on fiscal and monetary legs. Now that the RBI made its growth-supportive stance explicit, markets do no longer rule out additional rate action at April 7th meeting. The RBI action is now good to strengthen support at 61.7664, Fibonacci 61.8% retracement on May-Dec’14 rise. Especially if the US labor data reinforce Fed-hawks before the weekly close.
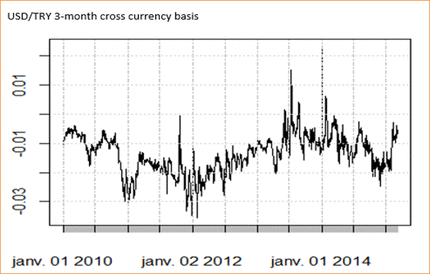
If the USD/TRY hit fresh all-time-high (2.5497) in Istanbul this morning, the move has no wonder something to do with the RBI action. On top of faster-than-expected core CPI fall in December (perfect excuse to fuel President Erdogan and government’s call for lower TRY rates), the RBI’s dovish move reinforced fears that the CBT can only see its refusal-margin collapse! This being said, we see the risk of political pressures increasing as Turkey’s economic situation remains gloomy three months before the general elections. The front-end of Turkey’s sovereign curve remains strongly inverted with the back end of the curve shifting higher as the country risk spills over longer maturities. The FX and money markets therefore are clearly positioned against additional rate action from the CBT, although President Erdogan points CBT Governor Basci as responsible for the economic slowdown! The 3-month cross currency basis hints at decreasing interest in TRY verse USD.
Brazil walks in the opposite direction
The Brazil Central Bank meets today and is expected to increase its Selic rate by additional 50 basis points to 12.75% to curb the inflationary pressures and ease the BRL sell-off on political/fiscal concerns. Despite relatively favorable rates and hawkish BCB stance, the BRL has hard-time attracting long positions. The latest CFTC data shows (as of Feb 24th), the net speculative long positions in BRL futures decreased for second consecutive week (to 4561 contracts) and the downtrend has perhaps strengthened since then. USD/BRL hit fresh 10-year high of 2.9342 yesterday, the 1-month implied volatility advanced to 17.8%. We believe the carry traders are waiting for the tensions to ease before jumping in long carry positions. A correction is certainly underway, yet we call for patience! With the US jobs data due on Friday, the selling pressures in BRL verse USD are expected to remain tight.
Falling interest in TRY vs USD

| Today's Key Issues | Country / GMT |
|---|---|
| Feb 27th MBA Mortgage Applications, last -3.50% | USD / 12:00 |
| Feb ADP Employment Change, exp 220K, last 213K | USD / 13:15 |
| Feb F Markit US Composite PMI, last 56.8 | USD / 14:45 |
| Feb F Markit US Services PMI, exp 57, last 57 | USD / 14:45 |
| Bank of Canada Rate Decision, exp 0.75%, last 0.75% | CAD / 15:00 |
| Feb ISM Non-Manf. Composite, exp 56.5, last 56.7 | USD / 15:00 |
| U.S. Federal Reserve Releases Beige Book | USD / 19:00 |
The Risk Today
Luc Luyet
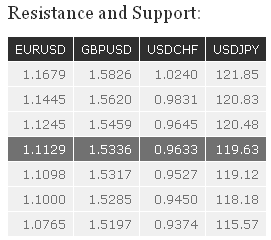
EUR/USD continues to move near the low of its declining channel. Further weakness towards the support at 1.1098 remains favoured. Hourly resistances can be found at 1.1245 (27/02/2015 high) and 1.1279 (20/02/2015 low). In the longer term, the symmetrical triangle favours further weakness towards parity. As a result, any strength is likely to be temporary in nature. Key resistances stand at 1.1679 (21/01/2015 high) and 1.1871 (12/01/2015 high). Key supports can be found at 1.1000 (psychological support) and 1.0765 (03/09/2003 low).
GBP/USD is weakening as can be seen by the break of the short-term rising trendline. Monitor the test of the hourly support at 1.5317. Another hourly support can be found at 1.5197. An hourly resistance lies at 1.5459 (27/02/2015 high), while a key resistance stands at 1.5620. In the longer term, the recent rise is seen as an oversold rebound, whose upside potential should be capped by the key resistances at 1.5620 (31/12/2014 high) and 1.5826 (27/11/2014 high). A strong support stands at 1.4814.
USD/JPY has faded near the key resistances area between 120.48 (11/02/2015 high) and 120.83. A support stands at 119.12 (see also the rising channel). Another support lies at 118.18. A long-term bullish bias is favoured as long as the key support at 110.09 (01/10/2014 high) holds. Even if a medium-term consolidation is likely underway, there is no sign to suggest the end of the long-term bullish trend yet. A gradual rise towards the major resistance at 124.14 (22/06/2007 high) is therefore favoured. A key support can be found at 115.57 (16/12/2014 low).
USD/CHF has broken the key resistance at 0.9554 (16/12/2014 high), confirming persistent buying interest. Another key resistance stands at 0.9831. Hourly supports can now be found at 0.9527 (02/03/2015 low) and 0.9450 (26/02/2015 low, see also the rising trendline). In the longer-term, the bullish momentum in USD/CHF has resumed after the removal of the EUR/CHF floor. The break of the key resistance at 0.9554 (16/12/2014 low) opens the way for a further rise towards the other key resistance at 0.9831 (25/12/2014 low). A key support can now be found at 0.9374 (20/02/2015 low, see also the 200-day moving average).

