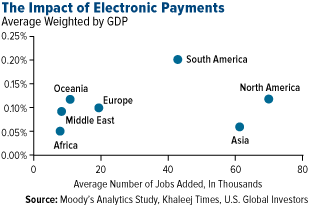
I want to point out that the digital banking system has made a huge impact on the UAE’s economy. I just read an article in the Khaleej Times newspaper, reporting that electronic payments have boosted the UAE’s GDP by $3.7 billion in five years. This increase is indicative of a trend of rising card usage across many countries, as you can see in the chart below.
In the same edition of the newspaper, I was interested to read that for the third year in a row, Singapore has been listed as the most expensive city in the world, followed by Zurich and Hong Kong.
According to the article, “Falling commodity prices have created deflationary pressures in some countries, but in others, currency weakness caused by these falls has led to spiraling inflation.” Light at the End of the Tunnel? The IEA Calls a Bottom in Oil Prices
Despite its relatively small size in population and land mass, the UAE is the world’s sixth-largest oil producer, following the U.S., Saudi Arabia, Russia, China and Canada. Among Organization of Petroleum Exporting Countries (OPEC) members, it’s the second-largest, after Saudi Arabia.
These rankings might very well rise in the coming years, however, as the Middle Eastern country plans to expand production between 30 and 40 percent by 2020, even as Brent crude prices have struggled to crack $40 per barrel.
But on a global scale, oil production is finally dropping—and that’s constructive for prices. In a report released on Friday, the International Energy Agency (IEA) writes that “prices might have bottomed out,” citing a February decline in both OPEC and non-OPEC output and hopes of U.S. dollar weakness.
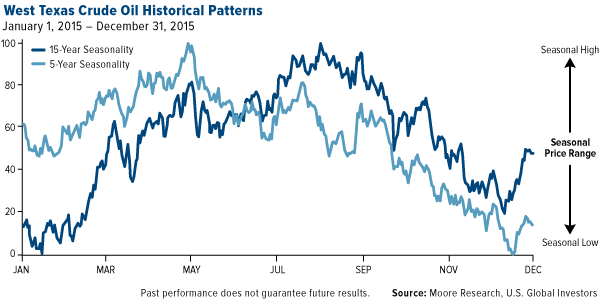
Although I’m cautious, the current recovery is in line with oil’s seasonality trends for the five- and 15-year periods, which show that prices have risen between March and the beginning of the busy summer travel season.
The PHLX Oil Service Sector Index has gained 4.4 percent since the beginning of the year, while prices have rallied above their 50-day moving average, touching three-month highs. 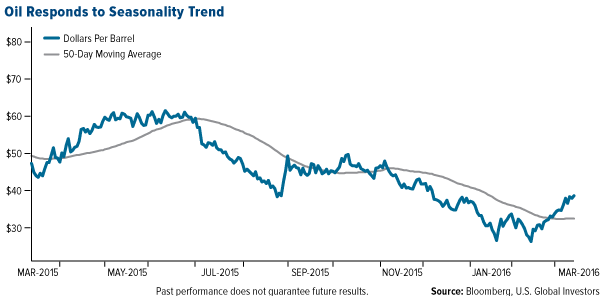
As the IEA points out, this rally is being spurred by optimism that OPEC and Russia can agree on a production freeze—not a cut, as some people think. A meeting date has yet to be decided upon, however, presumably because Iran announced it will not agree to an output freeze until it reaches its pre-sanction market share.
Like Iran, Saudi Arabia has resisted capping production. To plug up the deficit, it’s reportedly seeking up to $8 billion from international banks, the first time it has done so in more than a decade. The kingdom is also considering issuing foreign bonds and listing a part of its state oil company, Saudi Arabian Oil, or Aramco.
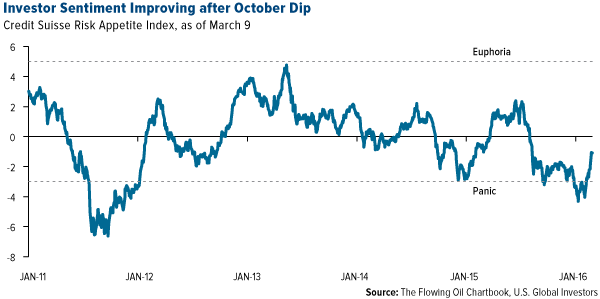
With WTI up 25 percent in 2016 and 3 percent in March, investor sentiment has improved since October, when it crossed into “panic” territory for the first time since 2011.
U.S. Companies Looking for $50 Per Barrel
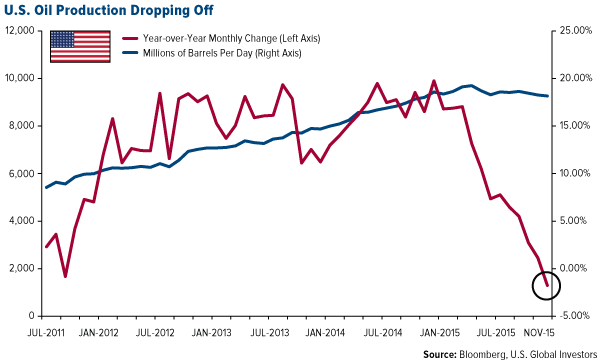
To remain profitable, most U.S. producers need oil prices to be above $50 per barrel—a level we haven’t seen in eight months. In such an environment, U.S. oil companies are finally beginning to make meaningful production cuts, with the IEA expecting producers to remove more than half a million barrels per day from the market this year. In December, the monthly year-over-year change in production turned negative for the first time since September 2011.
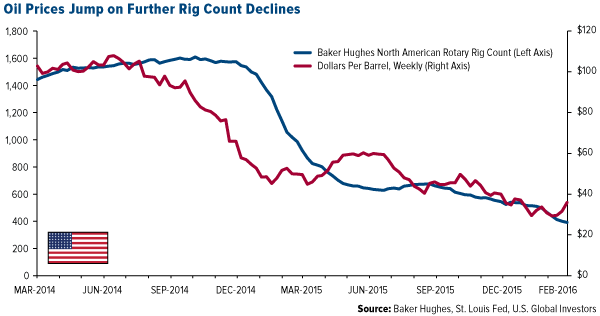
The number of North American rigs in operation fell below 400 for the first time since December 2009, according to Baker Hughes, helping to support prices.
Until now, per-well productivity has been slow to budge. Years of $100-per-barrel oil incentivized companies to develop new ways to extract crude, including fracking, and these technological advancements have greatly increased efficiency. Today, not only can a new well be drilled in record time, it can also produce four to five times what it could have only five years ago.
What Oil Companies Can Learn from Airlines
Highly-leveraged companies across the globe have had little choice but to trim their workforces, curb expenditures and let go of undeveloped projects. According to consulting firm AlixPartners, overall capital spending fell 20 percent in 2015, with a further decline of at least 30 percent expected this year.
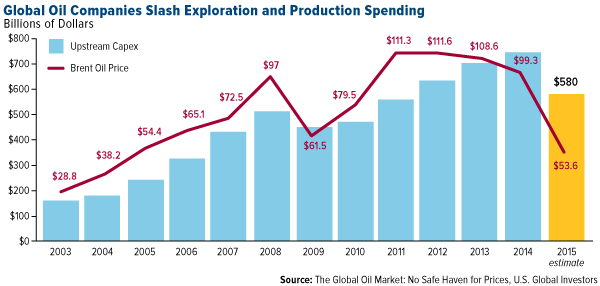
These adjustments, the most severe since the oil rout in the 1980s, have saved or raised global exploration and production (E&P) companies $130 billion, says Deloitte Consulting. But this won’t be enough for many companies: Nearly a third of all pure-play E&P companies worldwide are at high-risk of bankruptcy this year.
That’s not necessarily a bad thing. A little over a decade ago, the airline industry also found itself in extreme duress. A large percentage of carriers landed in bankruptcy court, and a wave of consolidation swept through the industry. Today, airlines are positing record quarterly profits.
In the past year, we’ve already seen some huge mergers and acquisitions in the oil industry—think Dutch Royal Shell (LON:RDSa) and BP (LON:BP), as well as the proposed Halliburton (NYSE:HAL) and Baker Hughes Incorporated (NYSE:BHI) deal. It’s likely we’ll see many more in the coming months. In the meantime, short of geopolitical turmoil, a coordinated production cap agreement among OPEC and non-OPEC countries might be the only option to firm up prices.
U.S. Global Investors, Inc. is an investment adviser registered with the Securities and Exchange Commission ("SEC"). This does not mean that we are sponsored, recommended, or approved by the SEC, or that our abilities or qualifications in any respect have been passed upon by the SEC or any officer of the SEC.
This commentary should not be considered a solicitation or offering of any investment product.
Certain materials in this commentary may contain dated information. The information provided was current at the time of publication.
Some links above may be directed to third-party websites. U.S. Global Investors does not endorse all information supplied by these websites and is not responsible for their content. All opinions expressed and data provided are subject to change without notice.
Some of these opinions may not be appropriate to every investor.
The PHLX Oil Service Sector Index (OSX) is a price weighted index composed of companies involved in the oil services sector.
The Credit Suisse (SIX:CSGN) Risk Appetite Index is a sentiment indicator designed by Credit Suisse comparing risk-adjusted returns across a wide spectrum of global assets.
Holdings are reported as of the most recent quarter-end. The following securities mentioned in the article were held by one or more accounts managed by U.S. Global Investors as of 12/31/2015: Baker Hughes Inc.

