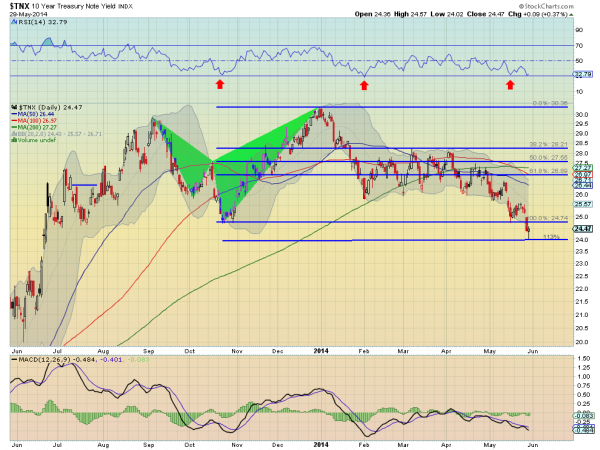
It has become fashionable to buy bonds again over the last month. What had been talked about as the end of the long term bull market in bonds was ending as of last fall and it was in favor to sell bonds. But the sell off did not hold and has bounced. This should not be a surprise that after 10 or 20 years or whatever that there are still bond buyers there to buy the dip. They were right to do so and are making money. But bond buyers may be losing their appetite now that the general public is ready to plow their 401k’s back into bonds. The chart below of the price action in the U.S. 10-Year Treasury shows the move higher in yield over the end of 2013 and then the pullback to start the new year. After a long pause the 10-year Treasury yield fell again in mid April and printed new 11 month lows Thursday. But there are signs that the bottom in yields may be in. At least in the short term. The price action has now retraced 113% of the move higher. This is an important Fibonacci level. It also printed a

Hammer reversal candle. This needs confirmation to be a trade signal. The RSI has also touched the 30 level where it has reversed before. The last time May 15 saw a short bounce, and the time before that February 3rd a more prolonged move but in a range, and the one prior to that October 23 the start of the move higher. So there is precedent for any of these scenarios to happen again. Or it can just keep going lower. But with any movement higher Friday it sets up a good reward to risk ratio for a trade based on yields moving higher.
The information in this blog post represents my own opinions and does not contain a recommendation for any particular security or investment. I or my affiliates may hold positions or other interests in securities mentioned in the Blog, please see my Disclaimer page for my full disclaimer.
