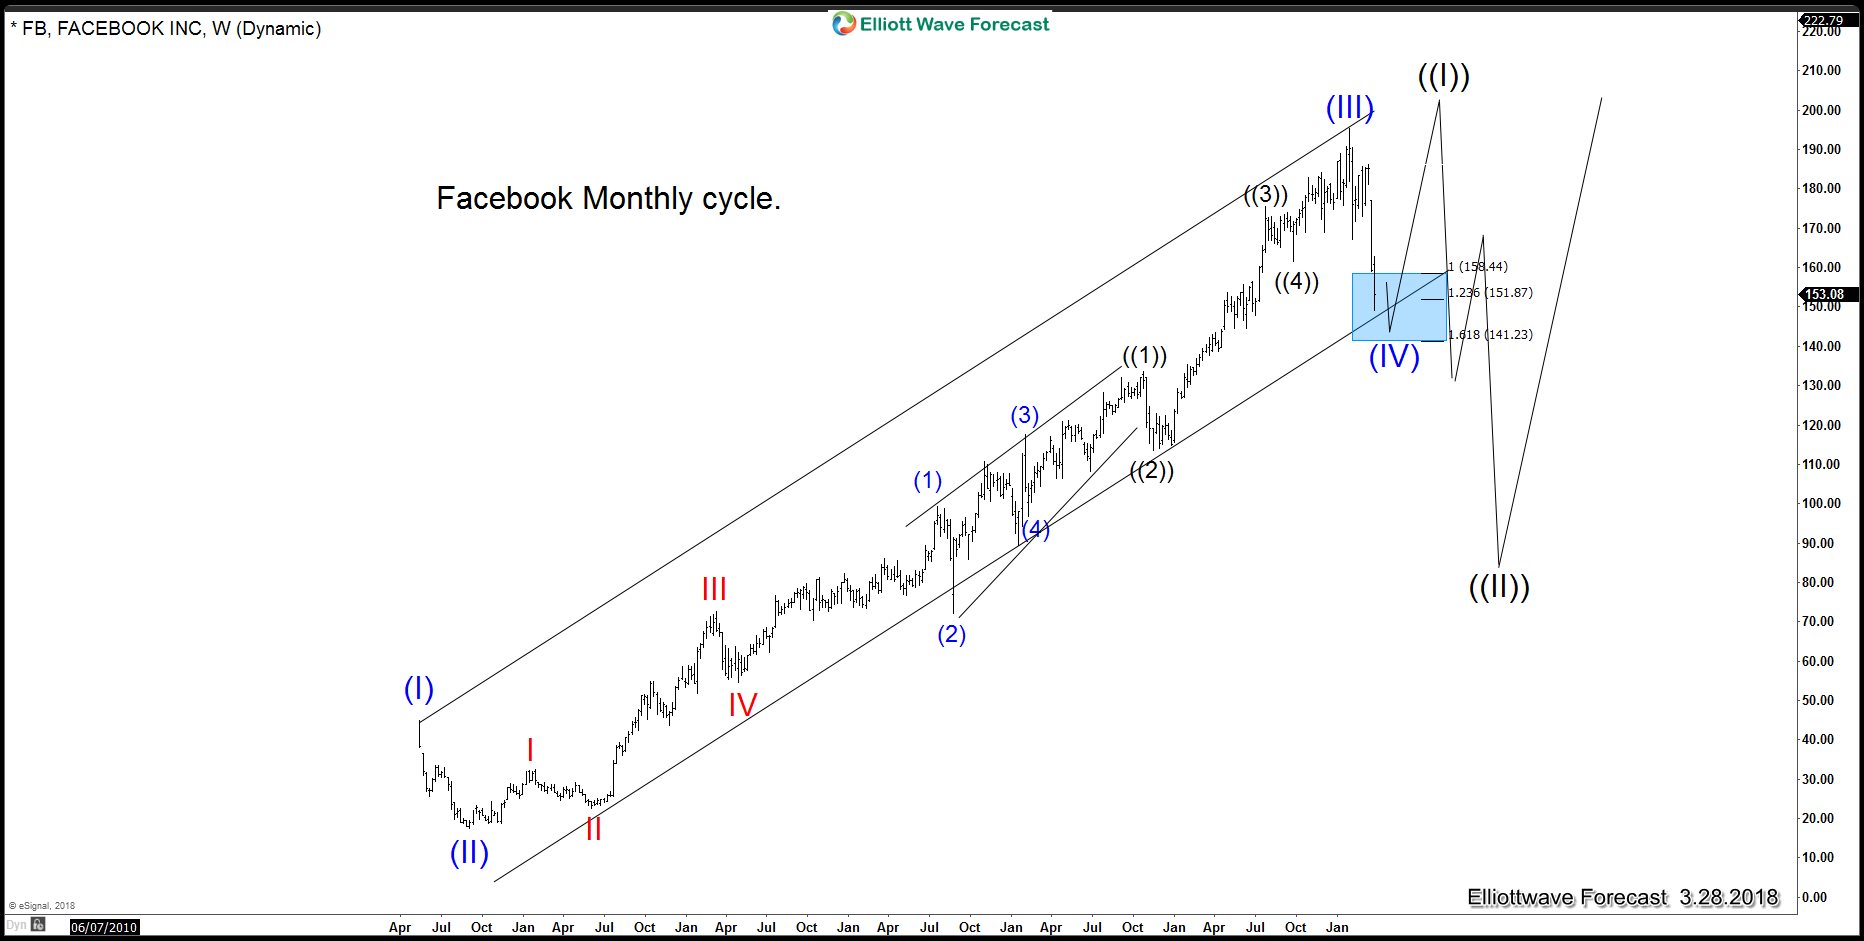
Facebook (NASDAQ:FB) has been on the news lately when the world discovered that more than 50 million users had their personal data breached with the downloading of Kogan’s Application, a data harvesting route, which due to the lax of structure of Facebook’s APIs at the time, allowed the foreign political consultancy firm to acquire information on more than 50 million Facebook users according to the Observer reports. Facebook has lost around $80 billion in Market value since the data scandal become public and creating fear among investors. As we keep mentioning that news and scandals come at the right time when the Market is ready for a pullback. We have been saying that the financial world was ready for a multi-month correction in 2018 and Facebook is also part of that world. Facebook trades the same side as many World Indices do and consequently, the data breach is the perfect case to justify the correction. We know it’s hard to digest that the Market follows a code and they work in a perfect sync, but we do understand the concept and see the patterns develop and happening with a perfect timing. Facebook is showing an impulsive Elliott wave advance since it’s IPO back in 2012 and can be counted completed based just in Elliott wave Theory. However, we do understand The One Market concept and consequently, we believe Facebook stock is currently doing a wave (IV) pull back and another high within this cycle remains a possibility and would be the ideal scenario. The chart below shows the Impulse advance since the lows at 2012 and how the instrument is within the channel and how we like still another high to happen from the Blue Box.
Facebook Elliott Wave Analysis: Weekly View
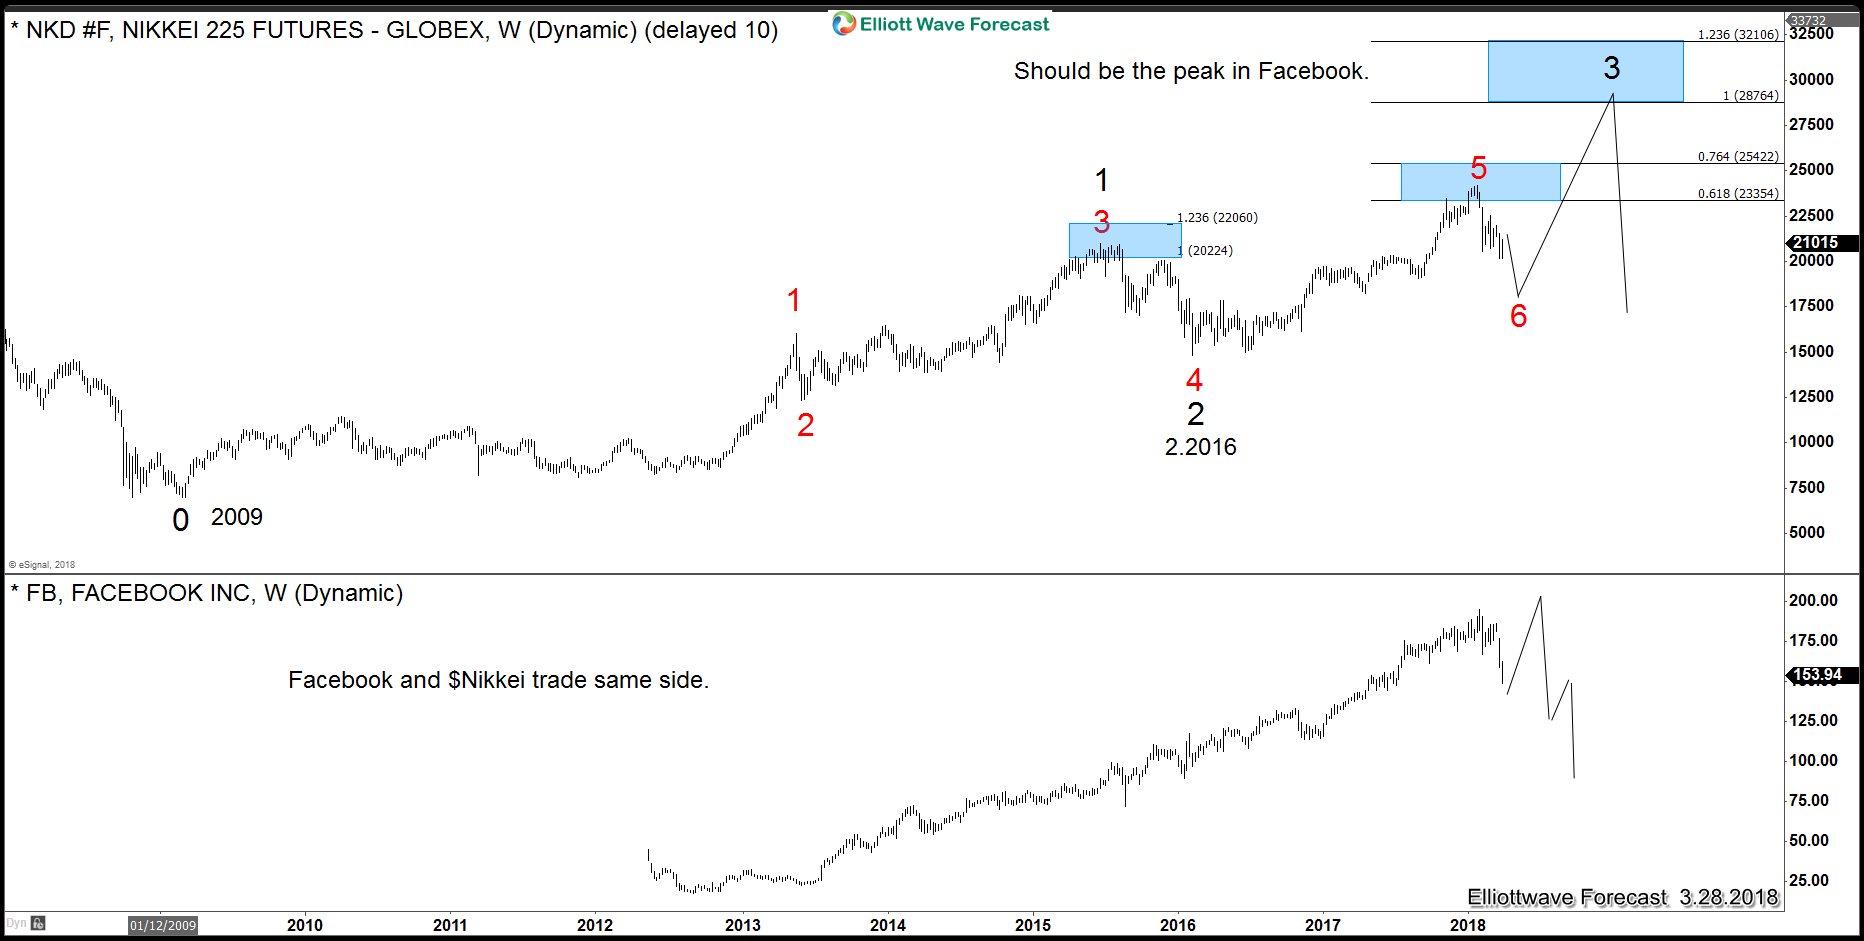
Based in World Indices sequences, we expect Facebook stock to push higher when the World Indices renew the trend after finishing the current pull back which started back in January 2018 and rally into the 2020-2022. It is from there, that we can see the biggest correction in World Indices and also in Facebook stock when it could pull back to correct the entire cycle from 2012 low. As we said earlier, based on subjective nature of Elliott Wave Theory, cycle from 2012 low could be counted completed as well but given a choice between calling the cycle completed or another high to end the cycle, we are going with another high because when we overlay Facebook with the $Nikkei Index’s incomplete sequences, we can see another high to end the cycle in Facebook makes more sense. The following chart shown the $Nikkei sequences overlaid with Facebook.

We tend to see the trend and the logic which implies that the Data scandal should not sink the company and in fact it is just another opportunity for the bulls to buy the stock for a new all time high or a larger 3 waves bounce at least to get into a risk free position.
