Investing.com’s stocks of the week
In previous articles, we’ve discussed numerous stocks, which brought their investors great returns in the past decade. Today’s material will focus on one that beats them all. DexCom (NASDAQ:DXCM) – a medical device company, headquartered in San Diego, California.
In November 2008, during the throes of the Financial Crisis, DXCM stock plunged to as low as $1.36 a share. In August 2019, the price reached an all-time high of $178.45. The math says this is 55.8% compounded annually for a total return of 13 000% in less than eleven years.

In contrast, the low at $1.36 in 2008 was the result of a selloff from $26.70 in April 2006. It turns out DexCom stock is not immune to price declines after all. The danger is that after many years of huge gains investors tend to forget the fact that no trend lasts forever. So let’s examine DexCom’s bull market through the prism of the Elliott Wave principle and see what’s left of it.
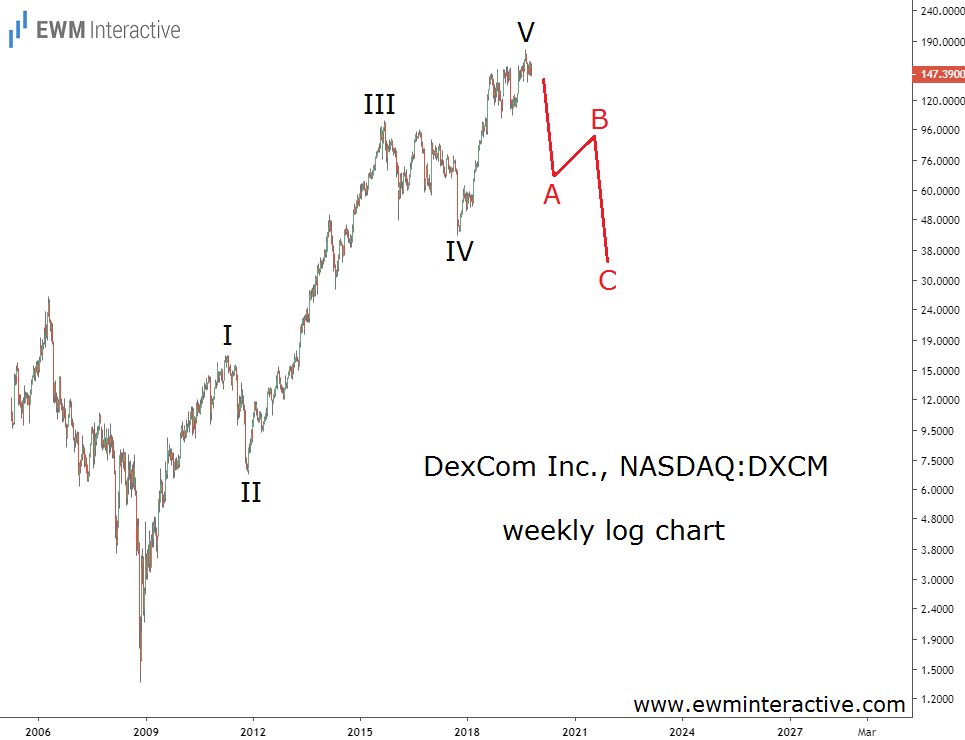
DexCom’s weekly logarithmic chart reveals that a complete five-wave impulse pattern has been formed. What the bulls probably don’t want to hear is that according to the Elliott Wave theory, every impulse is followed by a three-wave correction in the other direction.
This is the same pattern which led to an 86% crash in Cigna (NYSE:CI) in 2007-2008. A complete impulse pattern was also visible on the chart of EQT Corp (NYSE:EQT). right before its own 85% dive. In other words, a fully-formed impulse, labeled I-II-III-IV-V, must not be taken lightly by DexCom shareholders.
Usually, the corrective phase of the wave cycle erases all of the fifth wave’s gains. In DXCM’s case, this means a pullback to at least $42 a share where the support of wave IV lies. This would be a massive 70% crash from the current level of $147. Given that the company is barely profitable, we wouldn’t be surprised to see an even larger selloff in DexCom.
