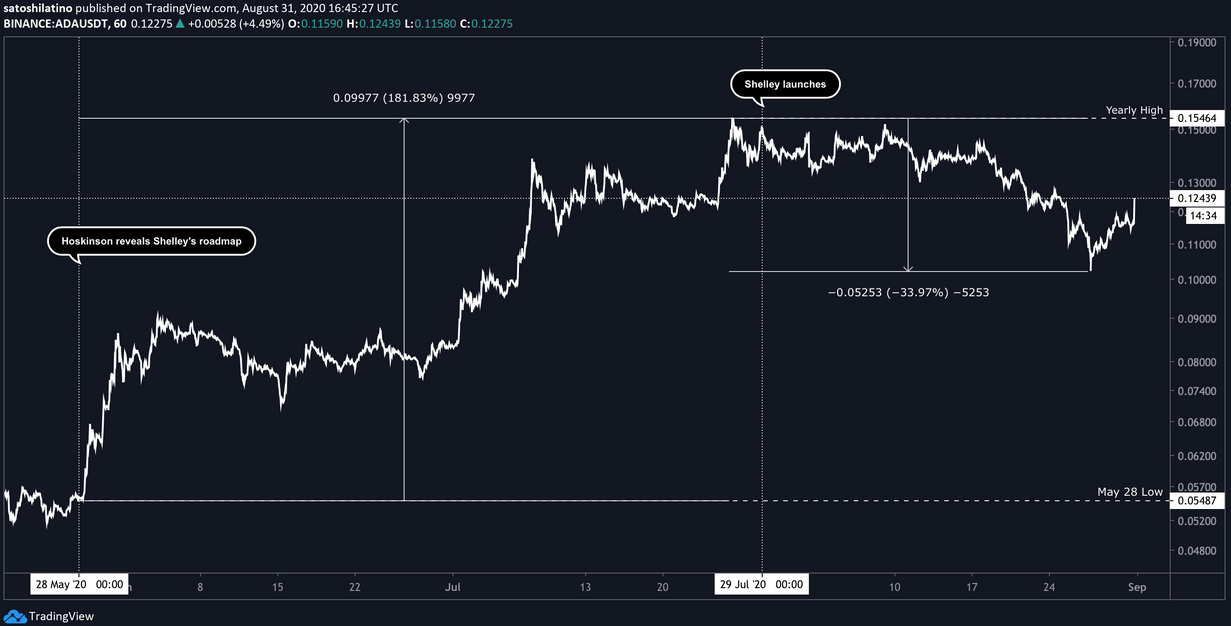
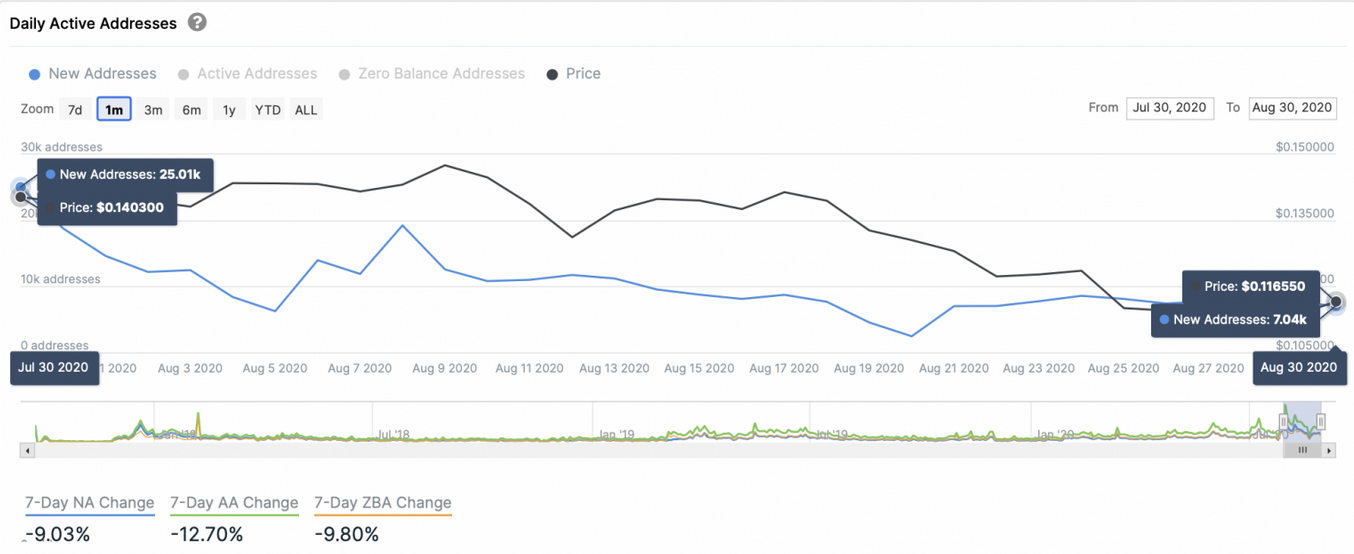
The hype around Cardano's staking rewards continues to fade as on-chain metrics struggle to hold up inflated ADA prices. Even though Cardano surged more than 20% over the past few days, on-chain metrics are pessimistic about near-term prices for ADA. Cardano’s recent price action suggests that Shelley’s launch on July 29 served as a “sell the news” event. After Cardano founder Charles Hoskinson revealed that the protocol was finally transitioning to a proof-of-stake consensus algorithm, ADA gained 182%, hitting a yearly high before launch. Following the hardfork, the hype died down, and ADA took a 34% nosedive to a low of $0.102. Since then, Cardano recovered some of these losses, gaining 22% and settling at $0.124. However, different on-chain metrics show that bulls will face difficulty moving prices any further. IntoTheBlock’s “In/Out of the Money Around Price” (IOMAP) model estimates that $0.114 plays a key role in Cardano’s trend. Transaction history shows that this is the largest supply barrier underneath the so-called “Ethereum killer” that could hold falling prices at bay. Here, over 12,000 addresses had previously purchased more than 2 billion ADA. This area could absorb some of the selling pressure from a fall, preventing Cardano from falling further. That said, if this support level breaks, then it could be catastrophic for those betting to the upside. The IOMAP cohorts show that the next significant supply level reinforcing ADA’s uptrend sits around $0.085. If both were to break, ADA holders should expect their investments to plunge by another 30%. Despite the grim worst-case scenario, the cryptocurrency market’s unpredictability means the bullish outlook cannot be taken out of the question. The IOMAP cohorts model shows that Cardano also faces stiff resistance ahead if there is a major upwards movement. Roughly 8,000 addresses hold 2.9 billion ADA between $0.131 and $0.134, meaning that it will take an enormous amount of buying pressure to send prices higher. Given these numbers, the odds currently favor a pessimistic short-term outlook on ADA. When looking at Cardano’s network growth, the bearish thesis holds. Since late July, the number of new daily ADA addresses has steadily declined. Roughly 25,000 addresses were joining the network on a daily basis around July 30. This number has dropped to 7,000 a day, representing more than a 70% drop. The downward trend in network growth is a red flag for price growth in the near future. Usually, a sustained decline in network growth is a leading indicator of deteriorating prices. The lack of newly-created addresses tends to affect the regular inflow and outflow of tokens in the network, and hence liquidity, so traders beware.Key Takeaways
Continued Sell-Off Following Shelley Upgrade

Critical Support Behind Cardano

Network Growth Declines

- English (UK)
- English (India)
- English (Canada)
- English (Australia)
- English (South Africa)
- English (Philippines)
- English (Nigeria)
- Deutsch
- Español (España)
- Español (México)
- Français
- Italiano
- Nederlands
- Polski
- Português (Portugal)
- Português (Brasil)
- Русский
- Türkçe
- العربية
- Ελληνικά
- Svenska
- Suomi
- עברית
- 日本語
- 한국어
- 简体中文
- 繁體中文
- Bahasa Indonesia
- Bahasa Melayu
- ไทย
- Tiếng Việt
- हिंदी
Despite Cardano’s Recovery, On-Chain Metrics Suggest ADA Prices Will Deflate
Published 09/01/2020, 12:57 AM
Despite Cardano’s Recovery, On-Chain Metrics Suggest ADA Prices Will Deflate
Latest comments
Loading next article…
Install Our App
Risk Disclosure: Trading in financial instruments and/or cryptocurrencies involves high risks including the risk of losing some, or all, of your investment amount, and may not be suitable for all investors. Prices of cryptocurrencies are extremely volatile and may be affected by external factors such as financial, regulatory or political events. Trading on margin increases the financial risks.
Before deciding to trade in financial instrument or cryptocurrencies you should be fully informed of the risks and costs associated with trading the financial markets, carefully consider your investment objectives, level of experience, and risk appetite, and seek professional advice where needed.
Fusion Media would like to remind you that the data contained in this website is not necessarily real-time nor accurate. The data and prices on the website are not necessarily provided by any market or exchange, but may be provided by market makers, and so prices may not be accurate and may differ from the actual price at any given market, meaning prices are indicative and not appropriate for trading purposes. Fusion Media and any provider of the data contained in this website will not accept liability for any loss or damage as a result of your trading, or your reliance on the information contained within this website.
It is prohibited to use, store, reproduce, display, modify, transmit or distribute the data contained in this website without the explicit prior written permission of Fusion Media and/or the data provider. All intellectual property rights are reserved by the providers and/or the exchange providing the data contained in this website.
Fusion Media may be compensated by the advertisers that appear on the website, based on your interaction with the advertisements or advertisers.
© 2007-2025 - Fusion Media Limited. All Rights Reserved.
