More than a year ago I reviewed Mr. Market’s offerings for yield-hungry investors and the results were meager, at least in comparison with historical payouts. How does the search-and-explore exercise compare today?
Yields on government bonds have fallen sharply, and so one would expect that slim pickings have become more so. Actually, the average trailing yield has ticked up for an equal-weighted mix of the major asset classes.
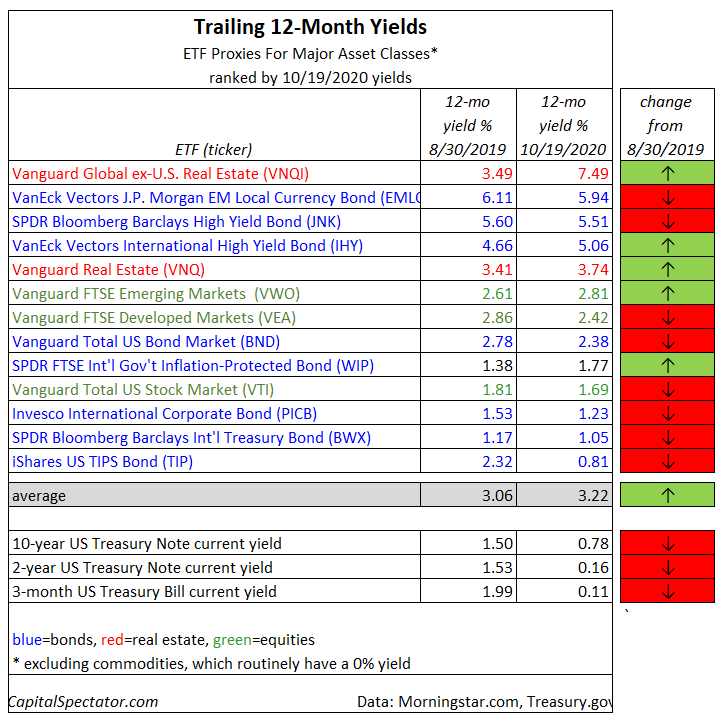
The average yield on this portfolio is 3.22%, based on the trailing 12-month payout as of yesterday (Oct. 19) via Morningstar.com. That’s up slightly from 3.06% on Aug. 30, 2019. Here’s how the various ETF proxies compare (in descending order according to the latest payout).

At the top of the list is an alluring 7.49% trailing 12-month yield for foreign property shares by way of Vanguard Global ex-U.S. Real Estate Index Fund (NASDAQ:VNQI). Property shares generally offer relatively high yields but VNQI’s outlier status for payout has been fueled by a tepid rebound after the coronavirus crash in the spring and so payout relative to price looks relatively elevated.
For comparison, the 10-year Treasury yield is a comparatively thin 0.78%, or roughly half the level from the Aug. 30, 2019 rate. Even more dramatic declines have been recorded for two-year and 3-month Treasuries.
The obvious question: How could Mr. Market’s portfolio yield ticked higher when interest rates have tumbled? A sharp slide in asset prices this year is the main reason. Note, however, that in some corners gravity has prevailed, but the gains in trailing payout have offset the declines.
As a result, an equal-weighted mix of the major asset classes (ignoring commodities) would currently post a higher trailing yield today vs. Aug. 2019. Encouraging, but there are caveats.
For starters, a trailing yield represents the past and there’s no guarantee that a payout over the last year will persist in the 12 months ahead. Stuff happens. Companies cut dividends, firms go bankrupt, foreign governments without the benefit of issuing the world’s reserve currency get squeezed by various macro and geopolitical risks. Accordingly, the table above is presented as a first approximation of what’s available in global markets at the moment when you cast a wide net in the desperate search for yield. Further research, however, is highly recommended.
The main takeaway: you can probably earn a higher payout vs. what the usual suspects offer in government securities. But as with every other corner of portfolio design, higher yields come with higher risks and so mindlessly chasing bigger payouts will likely end in tears. At the other extreme, accepting near-zero yields on cash and equivalents is going too far. The challenge, of course, is balancing risk and reward. That’s not getting any easier. The good news: opportunities exist, as the table above suggests.
