Continued contraction in corporate issuance of high-yield bonds is likely creating a supply-demand imbalance, helping the likes of iShares iBoxx $ High Yield Corporate Bond (NYSE:HYG).
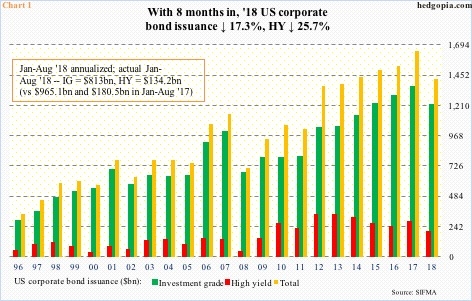
Eight months in, 2018 corporate debt issuance continues to shrink. August saw issuance of $98.6 billion, made up of $83.4 billion in investment grade (IG) and $15.2 billion in high-yield (HY). For the year, the eight-month total now stands at $947.2 billion, $813 billion and $134.2 billion, in that order. Over last year, 2018 issuance is down 17.3 percent, with IG down 15.8 percent and HY down 25.7 percent!
If the current trend persists in the remaining four months, this will be a first down year in total issuance in eight years (Chart 1). IG will be down for the first time in nine. After three down years, HY issuance rose last year; this year, it is on course to drop again.
It increasingly feels like the reduced supply of HY bonds is helping this asset class – to a point these securities are outperforming investment-grade bonds. Last December’s corporate tax cuts probably help as well, as lower tax payments improve their financials.
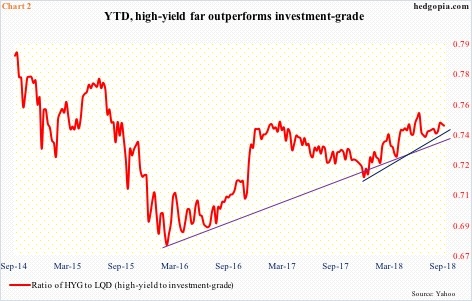
Year-to-date, HYG (iShares iBoxx $ high yield corporate bond ETF) is down 1.6 percent, versus LQD (iShares iBoxx $ investment grade corporate bond ETF) which is down 5.4 percent. In 2017, LQD was up 3.7 percent versus HYG’s 0.8-percent rise.
The ratio of HYG ($85.87) to LQD ($115.03) bottomed last December at 0.716, before rising to 0.754 mid-June. Since then, the red line in Chart 2 has come under slight pressure but the trend is up (blue line). As a matter of fact, the trend has been rising since the ratio bottomed in February 2016 (violet line).
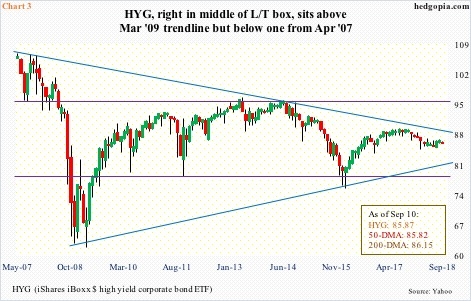
HYG clearly has been a relative outperformer versus its senior cousin. Although on an absolute basis, the ETF is at an interesting technical juncture. It began its life in April 2007, so has a relatively short history. Currently, it is smack in the middle of a multi-year rectangle. Concurrently, it has also been making lower highs and higher lows between $81 and $89, give and take (Chart 3). Whichever way it breaks is likely to trend for a while, creating an opportunity to either go long or short. Given where the US economic cycle is, odds favor HYG eventually breaks to the downside, but it is prudent to let the price tell us that.
Thanks for reading!


