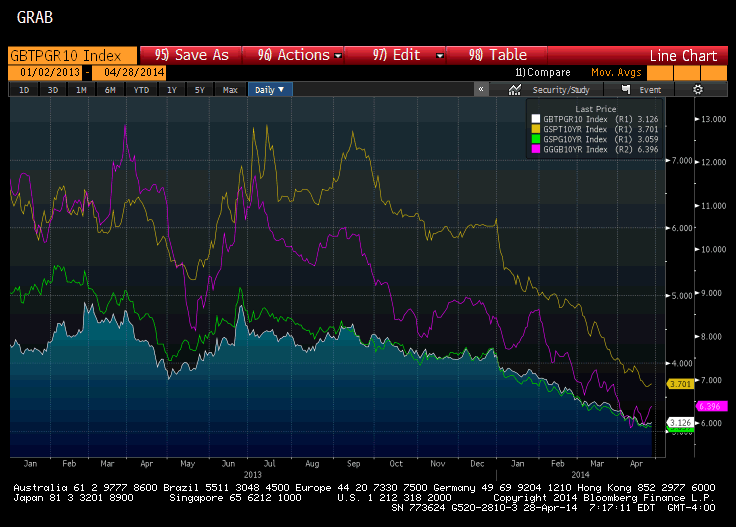
This Great Graphic, composed on Bloomberg, shows 10-year European peripheral yields since the beginning of last year. Italy is in white. Portugal is depicted by the yellow line and Spain, the green line. Greece is the pink line and is the outer scale.
While yields have tended lower since the middle of last year, Portugal's convergence toward Spain and Italy is remarkable. Since the beginning of H2 13, the 10-Year Portuguese yield has fallen 260 bp. That is twice as much as Italy and 100 bp more than Spain. Greece's high yield required a different scale, but its 10-Year yield has fallen about 435 bp through today.
Some part of the decline in nominal yields reflect the decline in inflation. Consider that the 130 bp decline in Italian 10-year yields is nearly matched by 110 bp decline in CPI between June 2013 and March 2014. Other peripheral countries have seen larger decline in real yield. Portugal's inflation has fallen 210 bp, which allows for a 50 bp decline in real yields. Spain has seen real yields come off 90 bp (240 bp decline in harmonized inflation and 150 bp decline in the 10-year nominal yield) Greece, has seen a 120 bp decline in CPI, means the real yield has fallen 300 bp.

