In recent commentary, I expressed an opinion that president-elect Trump faces numerous obstacles in stimulating the economy via tax cuts, regulatory reduction and infrastructure spending. The incoming administration is looking at an existing deficit of roughly $700 billion, tighter monetary conditions, higher borrowing costs in the near-term, highly leveraged households, highly leveraged corporations and $20 trillion in federal debt. In other words, Trump does not have the kind of favorable set-up that Reagan enjoyed in 1982.
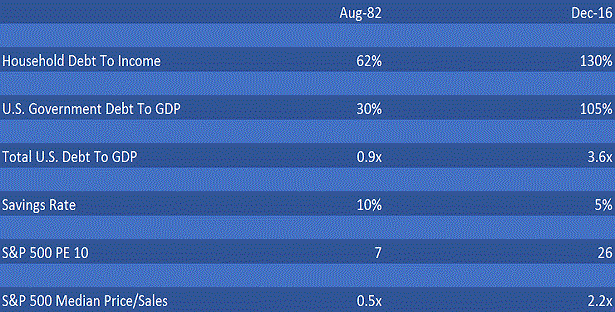
Nevertheless, I received a fair amount of push-back on the notion that leverage or debt or rising interest rates pose any sort of problem for the bull market in U.S. stocks going forward. Several comment writers attempted to explain that borrowing itself had been “lower” in 1982 with mortgages near 16% and that borrowing activity is much “higher” today with mortgages closer to 4%. Therefore, they claimed, household-debt-to-income of 130% in December of 2016 is not problematic for household free cash flow.
If only that were accurate.
Even at 16%, the homeownership rate in 1982 was 65.5%. The homeownership rate today? With mortgage near the 4% level? 63.5%. On a percentage basis, then, there was MORE borrowing to own a home at 16% in 1982; there is LESS borrowing to own a home at 4% here in December of 2016.
How is this possible? Skyrocketing property prices. Back in 1982, home-owning households spent 12% of family income on servicing the mortgage. Today, it is 16% of family income. That’s a 33% leap. Indeed, most buyers would be better off paying 1982’s 16% mortgage rate and having a more affordable house to own.
There are other factors at play as well. Homebuyers in 1982 had to put down the requisite 20% of the home price. That made it possible to weather the possibility of a recession and/or job loss. The bulk of 2016 homebuyers can put 3% down on a FHA loan, leaving them precious little room to withstand a downturn. Not much has been learned from our previous decade’s housing bubble, has it?
We have millions and millions of highly levered households. Nor is it confined to property leverage. Across the indebted household landscape, the average household sits on $16,000+ in credit card obligation. That’s near the 2008 peak. Is it at your low mortgage rate of 3.5% or 4.0% or 4.5%? Try 18.76% or roughly $1,300 in annual interest.
Now, $1300 per year may not matter to wealthy Americans; it may not matter to me. Yet that debt makes it far more difficult for many households to get by. It may be particularly troublesome, in fact, for the 120 million Americans that are part of a renting household. Why? Back in 1982, roughly 19% of household rental income went to servicing rent payments. Today? 28%. Never mind the unfortunate reality that 63% of Americans can’t pay for a $500 to $1,000 emergency. (See Bankrate.com.)
These are the type of numbers that clearly demonstrate why relying on debt for maintaining a standard of living today poses a threat to consumer spending tomorrow. That’s a serious dilemma for a service-based, consumer-oriented economy.
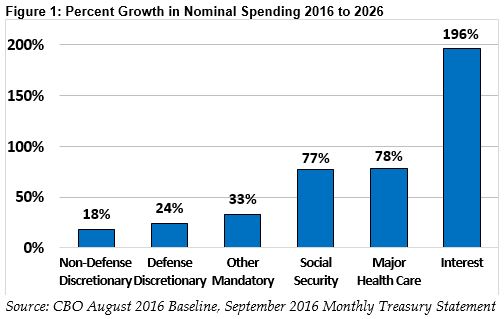
In fact, it is hard for me to fathom how there are those who can be so sanguine about debt levels. They dismiss household debt that is crippling so many Americans. They disregard $50 trillion in corporate debt because of today’s low interest rates, as if the debt will not need to be rolled over to new obligations in the future. They ignore $20 trillion in government obligation because of today’s low interest rates, as if the ever-increasing interest obligations would not constrain how the federal government pays for the needs of its citizens down the road.
Central bank manipulation of rates helped wealthy people get wealthier through the acquisition of income-producing, capital appreciating assets like stocks and rental real estate. Ultra-low borrowing costs certainly helped me. Yet they’ve done precious little for the bulk of American households. Many have been priced out of the American dream or forced to stretch way beyond a “20% down means.” Others must rent. Still others, mainly adult children, are living with their parents.
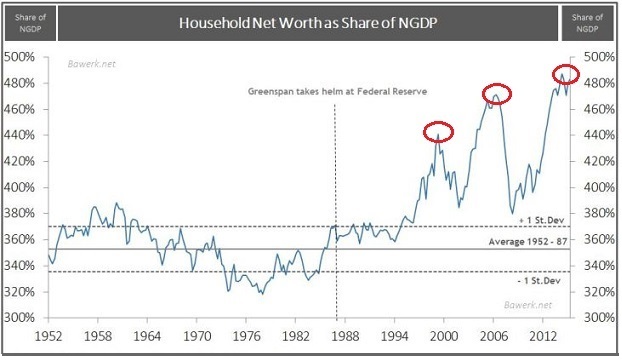
So please, dear commenters… tell me again how total debt levels are inconsequential. Trumpet the “achievement” of $90 trillion in asset price inflated household net worth, and how it compensates for debt.
Perhaps those who cite household net worth at $90 trillion as an extraordinary positive are completely unaware of the fact that the overwhelming majority of the wealth belongs to the top 5%-10%. Perhaps they are also unaware of the fact that one of the premier predictors of subsequent 10-year rolling returns for U.S. stocks (91% accuracy since 1952) is household equity percentage, which currently predicts little more than 3% annualized. Household equity percentage tends to be at its highest when household net worth is at its highest, like $90 trillion. And while 3% annualized cannot tell you when the downturn for stocks will come, the fact that the prediction is not near the total return average since 1870 (9.5%) hints at a reckoning or two before December 2026.
If one connects the debt dots, he/she can readily identify how low rate manipulation by the Federal Reserve did more than reflate asset prices alone. Reflated real estate prices have caused marginal buyers to stretch for the American dream with token down payments, while simultaneously leaving a larger base of renters struggling with significantly less disposable income than they might have had in the absence of rate manipulation.
Granted, central bank monetary policy is not the only reason for middle class woe. Wealthier individuals in the upper echelon have seen their wages grow handsomely over time. Middle class Joes? Wage stagnation.
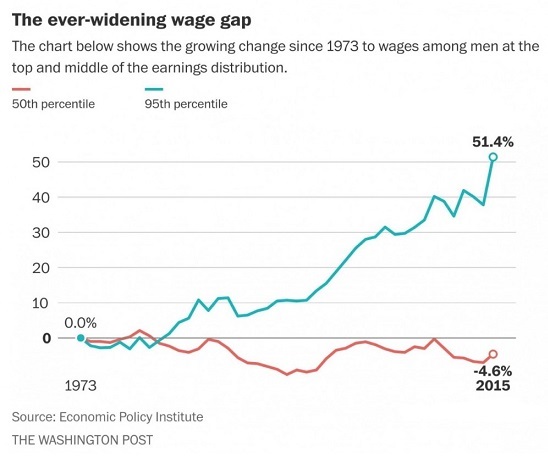
Central bank rate policy combined with corporate compensation have pushed income inequality into unfriendly territory. Bernie Sanders vowed to fix it through socialist redistribution. Donald Trump promises to fix it through the repatriation of corporate cash, shovel-ready infrastructure jobs, reduced regulation for smaller businesses and fair (if not free) trade. As different as both candidates for the presidency were, both individuals convinced voters they’d be fighting for the financially forgotten.
Unfortunately, president-elect Trump has a problem. Even before his administration serves up a greenback on infrastructure or tax cuts, they will inherit a deficit of roughly $800 billion and a 2018 borrowing need in the neighborhood of $1 trillion. Will Congressional Republicans suddenly go super soft on deficits and debt ceilings? That’s a pretty big assumption on the part of buyers at Dow 20,000.
The way I see it, modest alterations will be branded as tremendously powerful changes. Yet “Mr. Market” will call the bluff. Those who fade the Trump rally with some of their portfolio holdings will be far better positioned to put cash back to work at more attractive valuations.
Disclosure Statement: ETF Expert is a web log (“blog”) that makes the world of ETFs easier to understand. Gary Gordon, MS, CFP is the president of Pacific Park Financial, Inc., a Registered Investment Adviser with the SEC. Gary Gordon, Pacific Park Financial, Inc., and/or its clients may hold positions in the ETFs, mutual funds, and/or any investment asset mentioned above. The commentary does not constitute individualized investment advice. The opinions offered herein are not personalized recommendations to buy, sell or hold securities. At times, issuers of exchange-traded products compensate Pacific Park Financial, Inc. or its subsidiaries for advertising at the ETF Expert website. ETF Expert content is created independently of any advertising relationship.
