So something occurred to me yesterday morning: a “bounce” might mean different things to different people with yesterday’s 1% to 2.5% pop in the various equity indices counting for some, probably, as a legitimate bounce to be trusted.
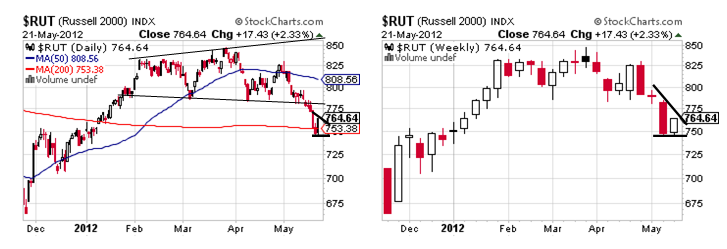
For me it would count as the beginning of a legitimate bounce if it did not appear to be taking the shape of an extreme Bear Pennant or Descending Triangle presenting in each of the equity index charts not to mention individual stocks, the precious metals and, of course, EURUSD, as a bit of consolidation that is warning of the likely continuation of the newly violent downtrend. These nascent patterns, interestingly, show as well in weekly form as in daily or intraday form and this supports the likelihood of success of each, in my view, and particularly in the context of a VIX that is getting ready to spike higher.
Should these Bear Pennants turn out to be good, today’s 1% - 2.5% move up in the equity markets will be completely forgotten not just by the weekly charts but by investors with the exception of those who may have tried to play it as a legitimate bounce and something that seems more like a 5%+ move up in the context of a 12% 13-day decline in the Russell 2000 that just happens to be showing one of the uglier bearish patterns out there.
It is ugly because this Descending Triangle shows well in daily form with its bearishness emphasized by its 200 DMA dance that is not over along with that rounding down 50 DMA but due to how strongly it presents in weekly form and a pattern that says just jump while there is a ship to jump from.
This Descending Triangle confirms at 746 for a target of 692 and it is aligned with the Russell 2000’s Broadening Top that confirmed at 781 for a target of 714 for a decline of about 10%. Unless the Russell 2000 can climb above last week’s high at 785, its chart is unbelievably and overwhelmingly bearish but above 785 and this small cap index will make another swipe up in the sideways trend.
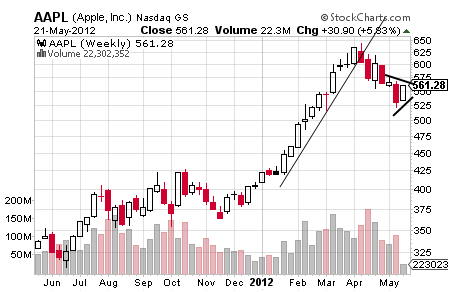
Let’s turn next to the strongest of these Bear Pennants and the one really to judge both the Nasdaq Composite and the S&P by and this is the horribly bearish Bear Pennant showing in the chart of the AAPL with this look presenting best in weekly form and the chart shown on the following page.
Jumping out the most to many probably is the unbelievable reversal of AAPL’s parabolic uptrend with much of it coming on the unmarked sideways trading of a Diamond Top but with that Bear Pennant ready to help the Diamond Top potentially reconfirm on a possible drop below $555 for a target of $466. 
What makes the Bear Pennant so helpful around AAPL, though, is the fact that it probably fails at $576 and a much better check than the $644 failure of the Diamond Top while its $468 target on confirmation of $522 basically matches, confirms and supports the Diamond Top.
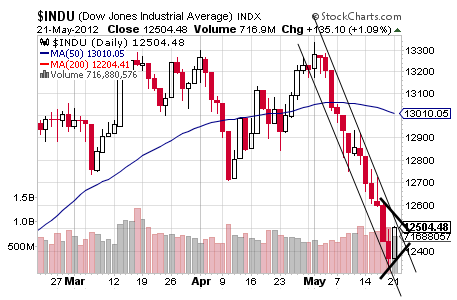
It is AAPL that helped the Nasdaq Composite pop by 2.5%, and what would seem to be the beginning of a real 5%+ bounce, along with the S&P, but even so, both of those indexes are showing ugly, ugly Bear Pennants that resemble the subtly super bearish quality of the Dow’s Bear Pennant that can be looked at in two ways.
Before looking at either way with one being bearish and the other being run-as-fast-as-you-can bearish, it seems worth noting that the Dow’s 1% move up today really cannot be considered a bounce of any kind considering it barely rose above Friday’s high and something true of the S&P too within the confines of a Descending Trend Channel.
Rather today’s move up in these two indexes brought investors basically even with Friday’s highs but nowhere near Thursday’s open and something that is true for the gamier likes of the Nasdaq Composite and Russell 2000 too.
Now let’s do the math on the Dow’s Bear Pennant for the application of the percentages across the board with both interpretations confirming at 12337 for a conservative target of 11774 and an aggressive target of 11335 for a 6% to 9% decline range from today’s close on top of its drop from the current and probably real top of 6%.
Put more simply, if these Bear Pennants and Descending Triangles work out in the equity indices, it probably means at least another 10% down and a decline that may follow a small move up at some point tomorrow for a day or two of resistance-capped range-bound trading before big declines come on what is likely to be more trouble out of Europe judging by EURUSD’s Bear Pennant that is already played out in the precious metals.
So in thinking about today’s move up in equities, it rings little of a real bounce to me with it seeming that little legitimate follow-through is likely and something that would be proven for me if the equity indices rise above last week’s high with even AAPL’s clearly legitimate 6% bounce today dimmed a bit by the fact that it comes in the context of this year’s 20%-from-the-top drop.
Rather it seems that today may turn out to be little more than the consolidating and falsely consoling – to some – brief reprieve of a dead cat bounce in an increasingly severe downtrend.
- English (UK)
- English (India)
- English (Canada)
- English (Australia)
- English (South Africa)
- English (Philippines)
- English (Nigeria)
- Deutsch
- Español (España)
- Español (México)
- Français
- Italiano
- Nederlands
- Português (Portugal)
- Polski
- Português (Brasil)
- Русский
- Türkçe
- العربية
- Ελληνικά
- Svenska
- Suomi
- עברית
- 日本語
- 한국어
- 简体中文
- 繁體中文
- Bahasa Indonesia
- Bahasa Melayu
- ไทย
- Tiếng Việt
- हिंदी
Dead Cat Bounce
Published 05/22/2012, 12:24 AM
Updated 07/09/2023, 06:31 AM
Dead Cat Bounce
Latest comments
Loading next article…
Install Our App
Risk Disclosure: Trading in financial instruments and/or cryptocurrencies involves high risks including the risk of losing some, or all, of your investment amount, and may not be suitable for all investors. Prices of cryptocurrencies are extremely volatile and may be affected by external factors such as financial, regulatory or political events. Trading on margin increases the financial risks.
Before deciding to trade in financial instrument or cryptocurrencies you should be fully informed of the risks and costs associated with trading the financial markets, carefully consider your investment objectives, level of experience, and risk appetite, and seek professional advice where needed.
Fusion Media would like to remind you that the data contained in this website is not necessarily real-time nor accurate. The data and prices on the website are not necessarily provided by any market or exchange, but may be provided by market makers, and so prices may not be accurate and may differ from the actual price at any given market, meaning prices are indicative and not appropriate for trading purposes. Fusion Media and any provider of the data contained in this website will not accept liability for any loss or damage as a result of your trading, or your reliance on the information contained within this website.
It is prohibited to use, store, reproduce, display, modify, transmit or distribute the data contained in this website without the explicit prior written permission of Fusion Media and/or the data provider. All intellectual property rights are reserved by the providers and/or the exchange providing the data contained in this website.
Fusion Media may be compensated by the advertisers that appear on the website, based on your interaction with the advertisements or advertisers.
© 2007-2025 - Fusion Media Limited. All Rights Reserved.
