Germany’s top index is testing the resistance at its all-time high levels but at this stage is not making inroads. A pullback provides some short and longer term opportunities.
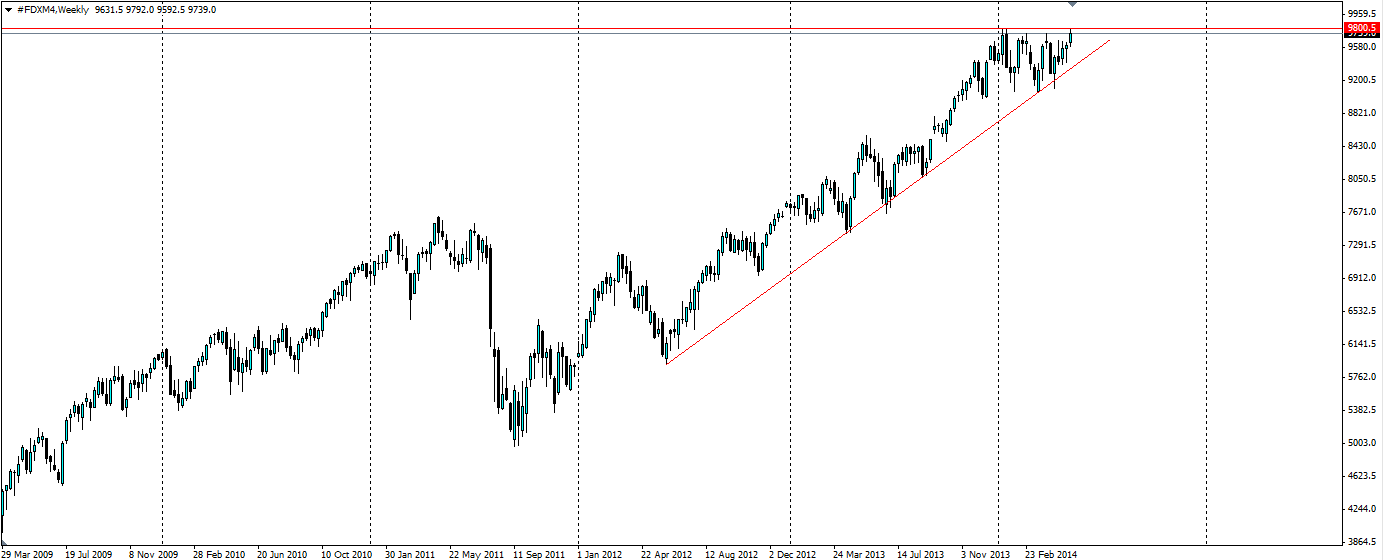
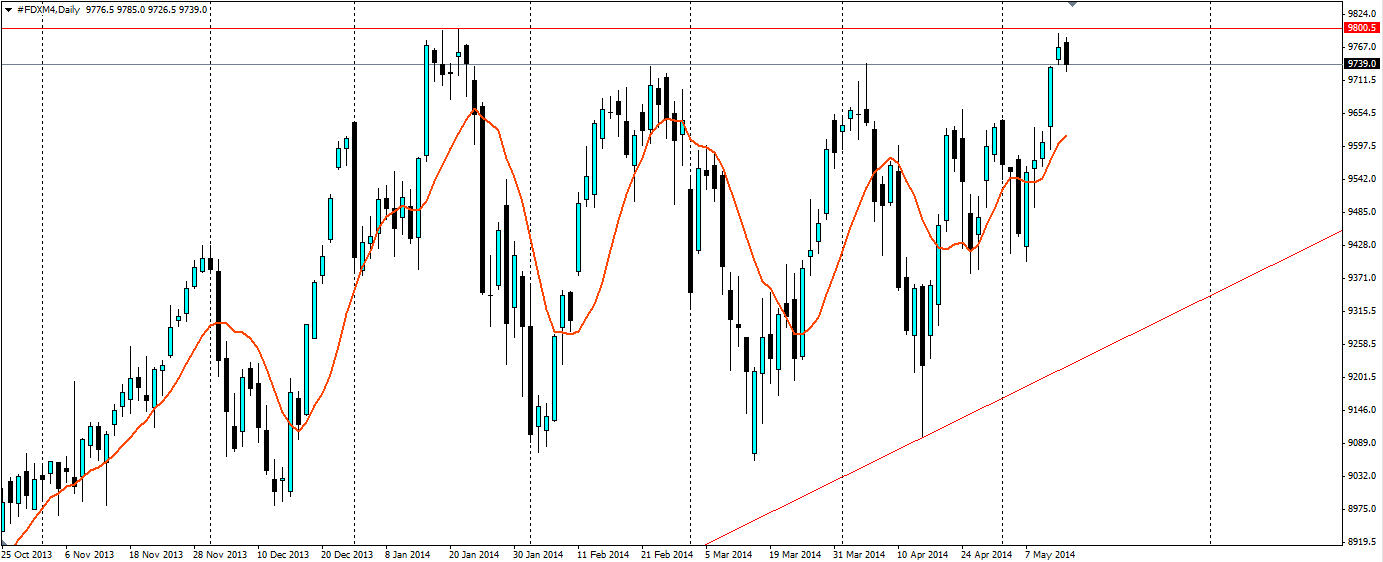
The DAX is an index that tracks Germany’s 30 largest companies and has a market cap of €598Bn. The Base date for the index is 30th December 1987, meaning it has risen almost nine times in value since then. On 21st January of this year, it posted a record high of 9800.5 but has since pulled back closer to 9000.0. It has since then ranged, forming several wave patterns.

This week was no exception as the price moved higher, touching 9792.0 before posting a bearish engulfing candle, confirming that this will not be the wave to break out of the resistance that has held the DAX advance in check for the duration of this year. This, however, presents us with an opportunity to trade the wave pattern that has been forming.

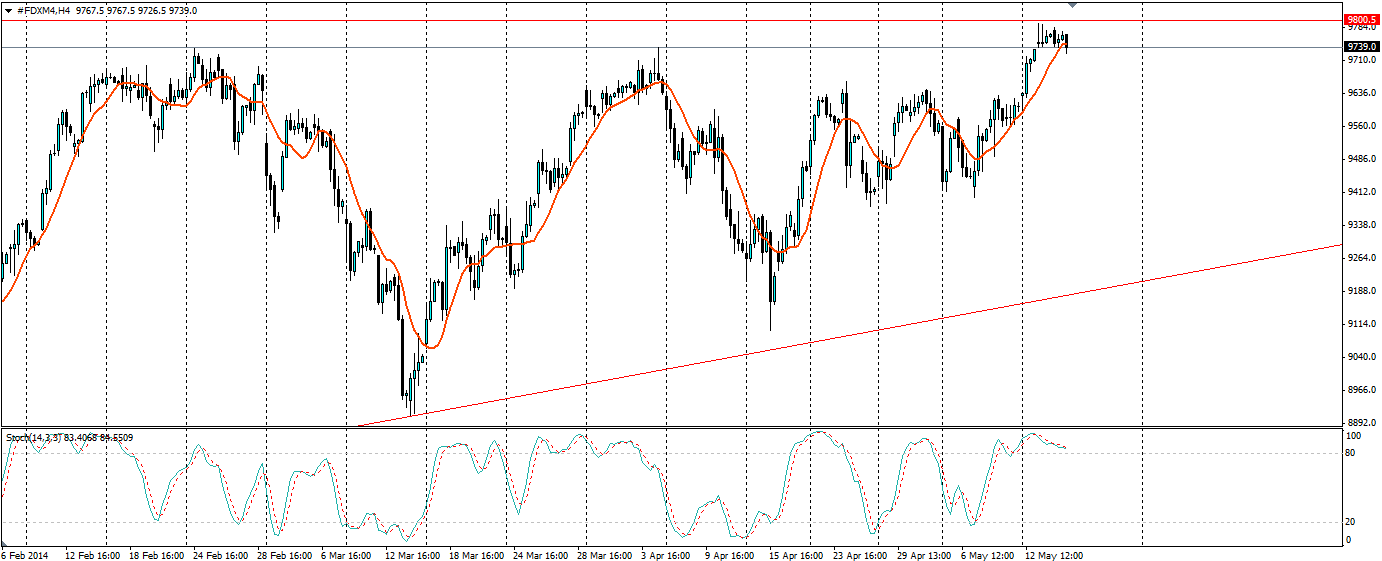
The Stochastic Oscillator on the H4 chart shows a clear reversal of momentum forming. This is a good indicator for traders to use when deciding to go short. With a value of 96.8 at the recent peak, the stoch is currently sitting at 83.4 and looking to move lower. It certainly looks like the bulls have run out of momentum for now.

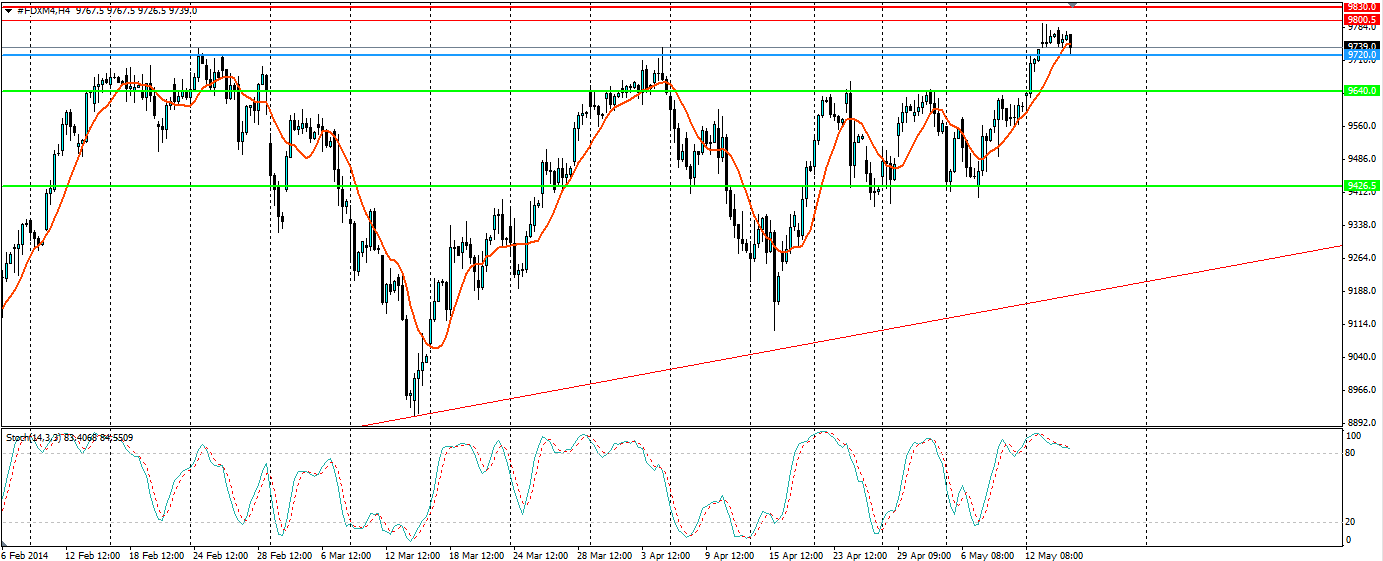
We can take the Stochastic as confirmation of a pullback and set a stop entry at 9720.0, just below yesterday’s low of 9726.5. A Stop loss can be set above the hard resistance at 9800.5, probably around the 9830 level or so because we do not want to be stopped out by a false breakout. Obviously, the higher we set this the less likely this will happen, but then we open ourselves to more risk if the breakout is genuine. Traders should manage their own risks with how comfortable they feel.
Finally for the target; a play like this has multiple options when looking at which support line to target. As we can see, each low is getting higher, so we do not want to go for something unobtainable. A safe option would be the support level at 9640.0, or for more risk we can target the previous low at 9426.5. The third target option, the bullish trend which has been in play since June 2012, is not like to give up without a fight, so this can be used as a dynamic target which traders should keep an eye on to exit at the optimal time.

The battle between the bulls and the bears, in this case the bullish trend line versus the resistance at 9800.5, will eventually come to a head and it is likely the bulls will win. But in the short term, we can play off a bearish pull back before the price bounces off the trend line for another attack.
