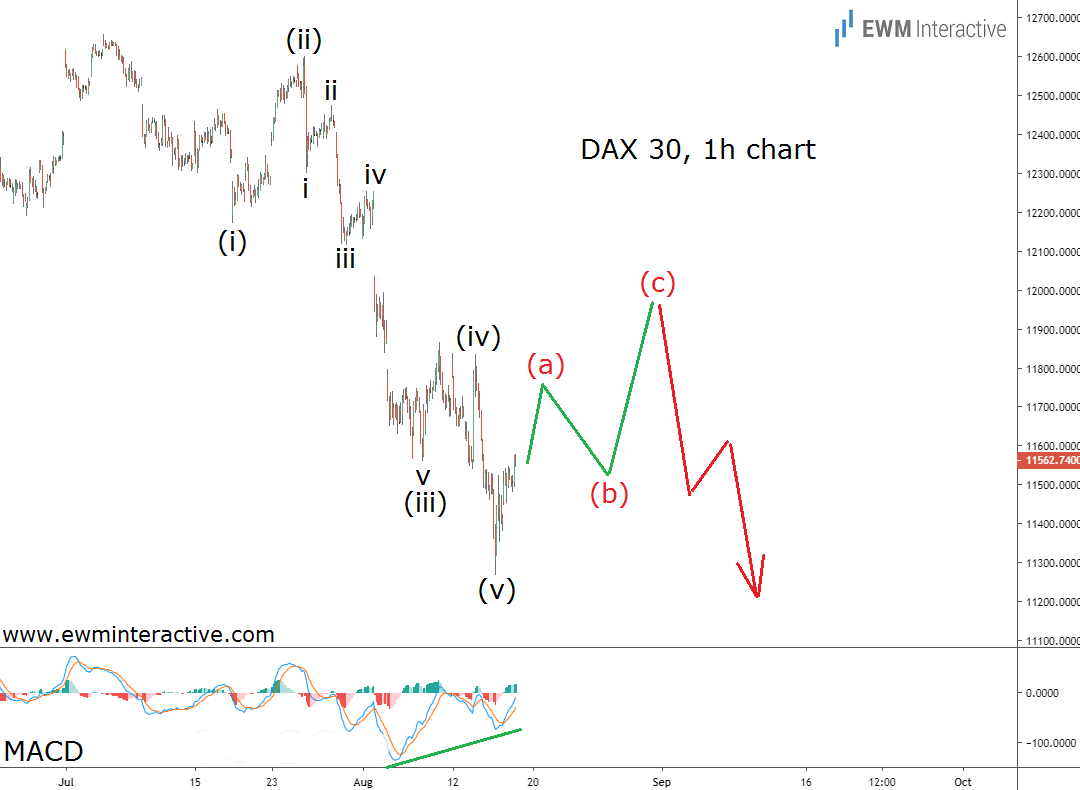
The German DAX 30 index has been declining since early July when it reached 12 656. Last week’s news that the German economy shrank by 0.1% in the second quarter only added to global recession fears. The benchmark index of Europe’s largest economy fell to 11 266 on August 15th.
Are investors’ concerns warranted? Or is this an opportunity to “be greedy when others a fearful?” Let’s see if the Elliott Wave chart below can help us find some answers.

The hourly chart of the German DAX 30 reveals that the structure of the decline from 12 656 to 11 266 is impulsive. The pattern is labeled (i)-(ii)-(iii)-(iv)-(v), where the five sub-waves of wave (iii) are also visible. Impulses point in the direction of the larger trend, which more or less answers our question. The bears remain in charge of the DAX 30. Lower levels can be expected in the months ahead
On the other hand, a three-wave correction follows every impulse before the trend can resume. A recovery to roughly 12 000 can be expect before the bears return. The MACD indicator also supports the short-term positive outlook. It shows a strong bullish divergence between waves (iii) and (v)
Even if the bulls manage to exceed 12 000, the negative outlook remains valid below 12 656. If this count is correct, this is not the time to be contrarian. The hourly chart of DAX 30 suggests investors are right to feel nervous this time.
