In less than four months, between December 20th 2017 and April 6th 2018, Dashcoin fell from an all-time high of $1550 to as low as $287, losing over 81% in market value. Fortunately, the month of April has been more generous, allowing the bulls to take a breather and lift Dash prices to $544 by April 24th. But the bears’ growl can be heard again today as DSH/USD hovers around $415. Has the larger selloff resumed or is this just a temporary decline within a larger recovery? The price chart of the thirteenth largest cryptocurrency can help us find out.
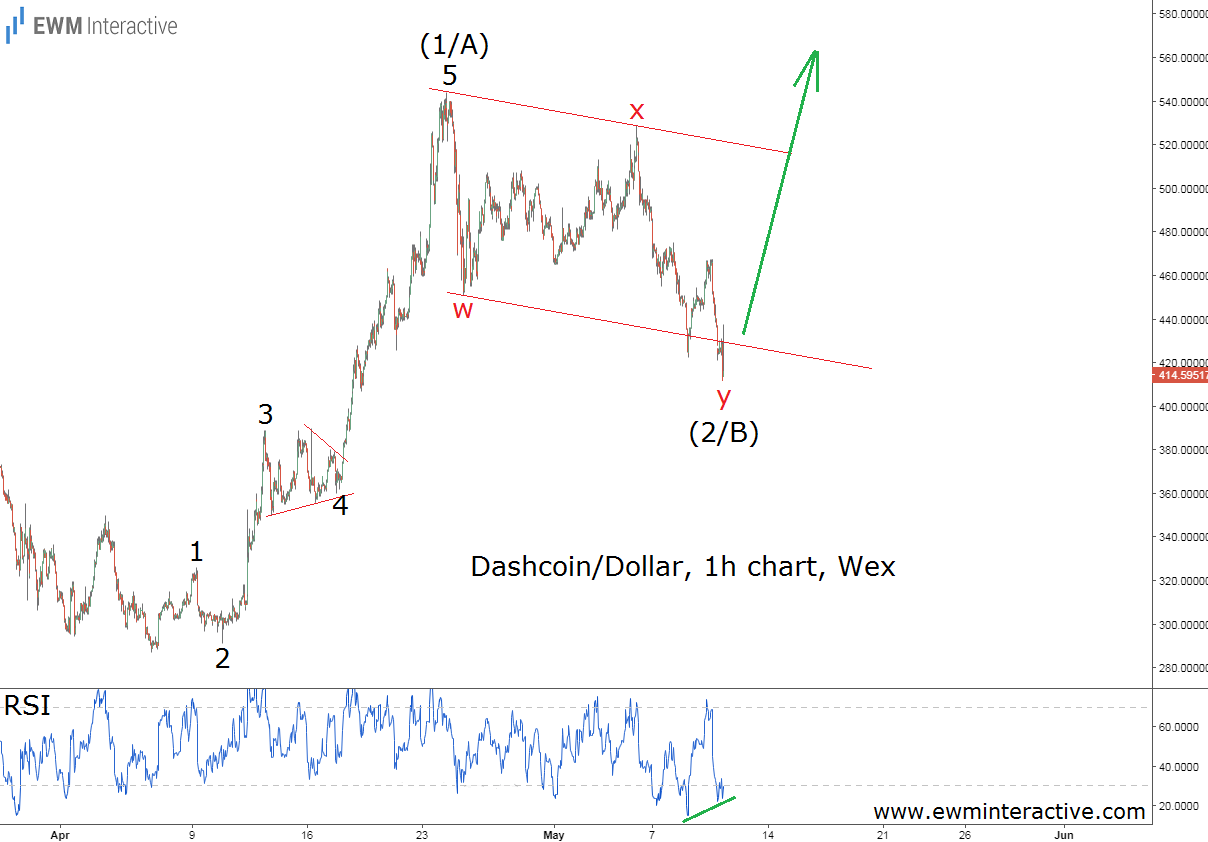
The hourly chart of Dash coin shows that the rally from $287 to $544 has an impulsive structure. It could easily be labeled 1-2-3-4-5, where wave 4 is a triangle and wave 5 is extended, but wave 3 is still longer than wave 1. According to the Elliott Wave Principle, this pattern means two things. First, since impulses develop in the direction of the larger trend, the pattern keeps the bulls’ hopes alive as long as Dash trades above $287. On the other hand, every impulse is followed by a three-wave correction in the opposite direction before the larger trend continues. That is what we believe the current plunge to $411.70 so far stands for – a w-x-y double zigzag retracement.
The corrective phase of the 5-3 wave cycle has been developing within the parallel lines of a corrective channel, whose lower line should discourage the bears and give the start of wave (3/C) up towards $550 or higher. The RSI indicator gives us another reason to be optimistic about Dash by depicting a bullish divergence between the last two lows of wave “y” of (2/B). If this count is correct, it is too early to give up on Dash. At least in the short-term, the outlook remains positive.
