Energy sector ETFs and mutual funds are in the Danger Zone this week. Despite the quality of stocks in the sector, ETF providers and fund managers are not offering quality funds. Even worse, they are charging disproportionately high fees for these low-quality funds.
Poor Stock Picking
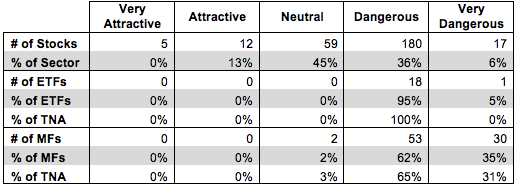
76 out of 273 stocks held by Energy ETFs and mutual funds (58% of the market cap) earn a Neutral-or-better rating. Despite this fact, none of the 19 ETFs and only 2 of the 85 mutual funds in the Energy sector even manage to earn a Neutral rating. Figure 1 has details.
Energy came in eighth out of ten sectors in my first-quarter “Sector Rankings for ETFs and Mutual Funds” report. It ranks behind the seventh-place Materials sector even though only 54% (versus 58% for Energy) of the stocks by market cap in the Materials sector earn a Neutral-or-better rating.
Ivy Global Natural Resources Fund (IGNAX) exhibits some of the worst stock picking in the Energy sector. It does not allocate any money to Attractive-or-better stocks while 42% of its assets are allocated to Dangerous-or-worse holdings.
Anadarko Petroleum Cop (APC) is one of my least favorite stocks held by IGNAX and earns my Very Dangerous rating. APC’s after-tax profit (NOPAT) in 2012 was roughly the same as in 2005, but its return on invested capital (ROIC) has shrunk from 13% to 5% over that timeframe. Liabilities that subtract from APC’s equity value, which include adjusted total debt, underfunded pensions, and deferred tax liabilities, add up to $31 billion (76% of market cap). Rather than reflecting these liabilities, APC’s stock is priced for significant growth. APC’s valuation of ~$80/share implies that the company will grow NOPAT by 10% compounded annually for 32 years. It’s hard to see why an investor would want to bet the company will surpass those high expectations.
Heavy allocation to APC and other overvalued stocks like it earn IGNAX my Very Dangerous rating and put Energy sector funds in the Danger Zone.
High Fees
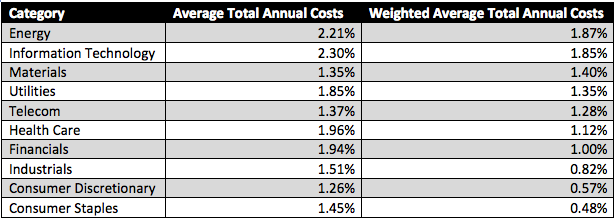
IGNAX is also guilty of the other major sin that many Energy ETFs and mutual funds commit. It charges exceedingly high total annual costs of 4.10%. 11 of the 85 mutual funds in the Energy sector charge total annual costs of over 4%. Similarly, 8 out of 19 Energy ETFs charge total annual costs of over 0.60%. For comparison, only 2 out of 8 Utilities ETFs charge total annual costs above 0.60% and only 2 of 33 mutual funds in the Utilities sector charge over 4% a year. Figure 2 confirms that Energy funds are the most expensive.
Figure 2 takes into account both ETFs and mutual funds. Only Information Technology funds have a higher average cost, but Energy funds are the costliest when weighted by assets under management. Energy funds are almost four times costlier than Consumer Staples funds. Not coincidentally, Consumer Staples is my top rated sector.
Energy funds should not get away with charging such high fees for such poor stock-picking. The fact that weighted average costs are below the average costs for the sector shows that investors are favoring the cheaper funds, which is a good sign, but too many high cost funds remain.
The Best of the Worst
Only two mutual funds, WorldCommodity Fund (WCOMX) and ICON Energy Fund (ICENX) earn a Neutral rating in the Energy sector. ECOMX has only $2 million in assets, but ICENX has a respectable $752 million in assets. ICENX also charges below average (for this sector) total annual costs of 1.56%.
ICENX’s portfolio is much stronger than most others in the Energy sector. Over 13% of its assets are allocated to Attractive stocks, while only 22% of its assets are in Dangerous-or-worse stocks. This portfolio is not great by any means, but, at least, it’s enough to earn ICENX my Neutral rating.
Chevron (CVX) is one of my favorite stocks held by ICENX and earns my Attractive rating. From 2002 to 2012 CVX grew NOPAT by 20% compounded annually while increasing ROIC from 4% to 11%. 2013 was not a great year for CVX, but its strong track record suggests that the decrease in profits was a blip rather than the start of a trend. For long-term investors, CVX’s recent earnings disappointment is a boon, as it gives them an opportunity to get in at lower prices. Down 11% already in 2014, CVX looks enticingly cheap right now. At its current valuation of ~$111/share, CVX has a price to economic book value ratio of only 0.75, which implies a permanent 25% decrease in NOPAT from its 2012 level. I can’t see a company as well run as CVX experience such a large profit decline for an extended period of time.
ICENX still holds plenty of poor stocks, but its allocation to CVX and other undervalued companies helps balance out the bad. Normally, ICENX would be a middle of the road fund, but in the poor Energy sector it manages to rise to the top. If ICENX is the best this sector can do, investors would be better off buying individual stocks instead and not paying any management fees.
Sam McBride contributed to this article
Disclosure: David Trainer is long CVX. David Trainer and Sam McBride receive no compensation to write about any specific stock, sector, or theme.


