As non-GAAP earnings grow ever more prevalent in the market, despite the SEC stepping up scrutiny, investors are left in a mess of non-comparable metrics that provide little insight into the economics of a business. The non-GAAP problem is amplified when executives fully embrace the reporting practice, are paid on non-GAAP, and measure the success of the firm based on non-GAAP. This week’s Danger Zone is a company that claims consistent profitability and continued success, despite years of shareholder value destruction. Misleading non-GAAP results, large losses, and an overvalued stock price land 8×8 (EGHT: $14/share) in the Danger Zone.
Revenue Growth Masks Profit Decline
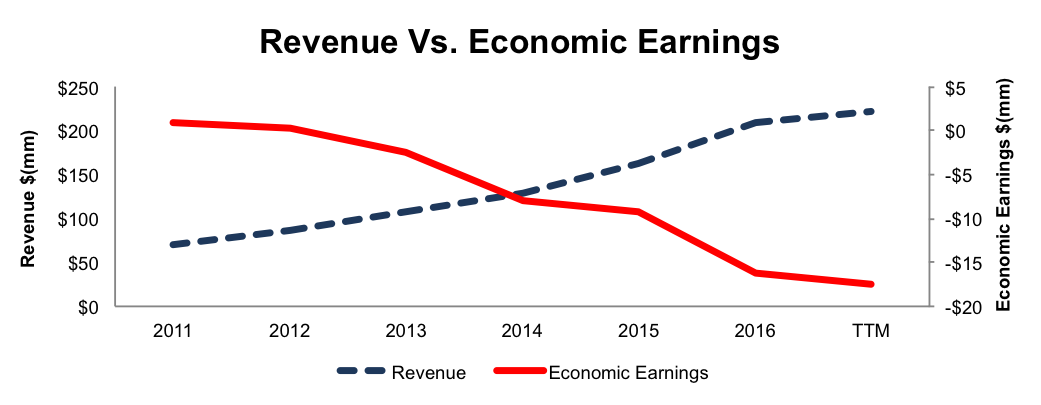
8×8’s economic earnings, the true cash flows of the business, have declined from $1 million in 2011 to -$16 million in 2016 and to -$18 million over the last twelve months (TTM). This decline comes despite revenue growing from $70 million in 2011 to $209 million in 2016, or 24% compounded annually. Figure 1 highlights the disconnect between revenue and economic earnings. See the reconciliation of 8×8’s GAAP net income to economic earnings here.
Figure 1: Economic Earnings Fall While Revenue Rises

Sources: New Constructs, LLC and company filings
Fundamental problems can be seen across multiple facets of the business. 8×8’s return on invested capital (ROIC) has fallen from 12% in 2011 to a bottom quintile -3% TTM. The company’s after-tax profit (NOPAT) margins have declined from 9% in 2011 to -2% TTM. Lastly, 8×8 has burned through cumulative $73 million in free cash flow since 2011.
The clear deterioration of operations is caused by 8×8’s aggressive spending. Since 2011, while revenue has grown 24% compounded annually, R&D, Sales & Marketing, and General & Administrative costs have grown 38%, 28%, and 40% compounded annually respectively. Cost of revenues has grown 20% compounded annually over the same time. Revenues are growing quickly, but slower than expenses.
Executive Compensation Leads to Shareholder Value Destruction
Executives at 8×8, apart from base salaries, receive annual cash bonuses and long-term equity awards. The annual cash bonuses are paid out based upon the achievement of target non-GAAP pre-tax net income and organic recurring service revenue goals. Non-GAAP pre-tax net income has a long list of items that are removed to calculate the metric, including acquisition costs and stock based compensation. Executives are incentivized by metrics that lead to shareholder value destruction. Further shifting executive interests away from those of shareholders, 8×8’s long-term equity awards vest upon the achievement of total shareholder return relative to the Russell 2000. Incentivizing executives with stock price can be ill-fated, as business decisions can be made only to drive stock short-term stock price appreciation with little regard to the long-term economic success of the business.
The best way to create shareholder value, and align executives with the best interest of shareholders, is to tie performance bonuses to ROIC because there is a clear correlation between ROIC and shareholder value.
Non-GAAP Income Rises While Economic Earnings Fall
The dangers of non-GAAP metrics can sneak up on investors who trust management’s non-GAAP metrics. In fact, in the company’s 1Q17 earnings conference call, 8×8’s CEO states, “For the 25th consecutive quarter, 8×8 remains profitable on a non-GAAP basis.” Later in the call, the company’s CFO states “We’re good stewards of the shareholders’ money. We have been profitable now for 25 consecutive quarters.” While true on their face, those statements do not reflect shareholders’ best interests. Here are some of the expenses EGHT has removed to calculate its non-GAAP net income:
- Stock based compensation expense
- Acquisition related expense
- Management transition expense
- Facility exit expense
- Loss on investments
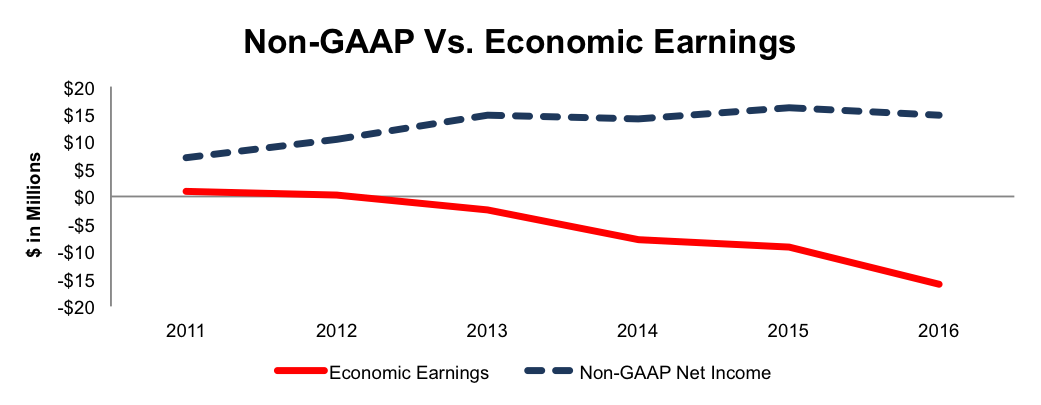
It’s not hard to be “profitable” when removing so many standard costs of running a business. These costs have a material impact on 8×8’s financials, particularly stock-based compensation. In 2016, EGHT removed $16 million (>100% of GAAP net income) in stock-based compensation to calculate its non-GAAP net income. Similarly in 2015, the company removed $9 million in stock-based compensation, which was nearly five times greater than GAAP net income. By removing this large expense, along with others, 8×8 reports non-GAAP metrics that are much better than economic earnings. Non-GAAP net income grew from $7 million in 2011 to $15 million in 2016, or 16% compounded annually. Meanwhile economic earnings declined from $1 million in 2011 to -$16 million in 2016, per Figure 2.
Figure 2: EGHT’s Misleading Non-GAAP Income

Sources: New Constructs, LLC and company filings
Lacking Profitability In A Fragmented Market
The cloud service industry is highly fragmented. Within the cloud industry, the unified communications industry hosts numerous firms all offering similar products, but with vastly different financial profiles. 8×8 faces competition from cloud based communication providers such as Ringcentral (NYSE:RNG), inContact (NASDAQ:SAAS) and Five9 (NASDAQ:FIVN). Other communication providers that also offer collaboration software include Cisco Systems (NASDAQ:CSCO), Microsoft (NASDAQ:MSFT) and Alphabet (NASDAQ:GOOGL). Lastly, 8×8 faces competition from incumbent telecommunication and/or hardware providers such as AT&T (NYSE:T), Verizon (NYSE:VZ) and Mitel (NASDAQ:MITL).
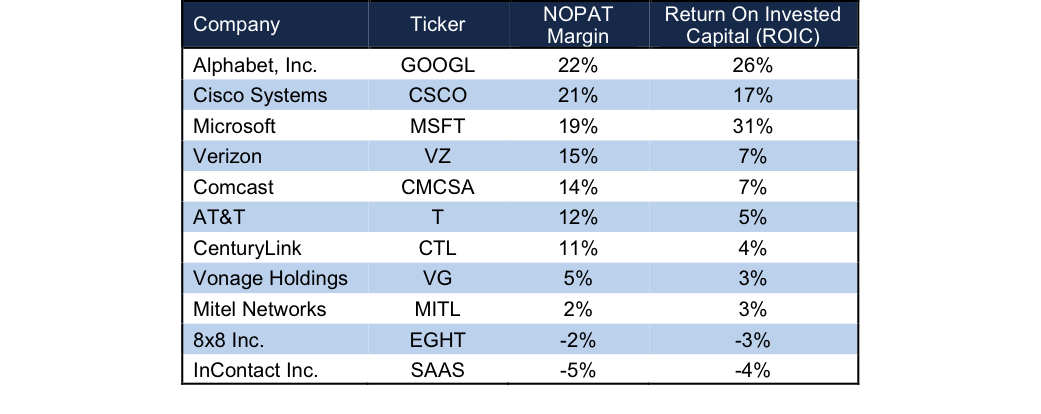
8×8 is at a significant competitive disadvantage due to its low profitability. Per Figure 3, 8×8 has a higher NOPAT margin and ROIC than only one competitor, inContact (NASDAQ:SAAS). Such low, and negative, profitability leaves EGHT with little to no pricing power while spending unsustainable amounts of money to win business, as noted earlier. Companies can sacrifice margins in the short-term to boost revenue growth, but long-term, a firm with relatively limited pricing power is at the mercy of competitors who are so much more profitable.
Figure 3: 8×8’s Profitability Falls Below Almost All Competitors

Sources: New Constructs, LLC and company filings
Bull Hopes Imply First-Mover Advantage Holds True
As with most new cloud companies, the case for investing in EGHT revolves around its ability to reach critical mass, supplant the incumbents, grow into the large communications market, become profitable, or any combination of the above. 8×8 is not an upstart hoping to break through. The company has been accumulating losses for over two decades.
When 8×8 fully began fully integrating its current product lineup of unified communication products, contact center, and cloud offerings, one could argue the firm had a strong first mover advantage. Cisco was still focusing largely on its equipment based enterprise communications, and cloud offerings were still a “new” feature. Since then, Cisco has moved to rapidly adopt cloud integration, Microsoft has moved numerous services into the cloud and ramped up its communications business, and many competitors have created or improved cloud services. While 8×8 may have had a multi-year head start, that first mover advantage has rapidly eroded (see profitability above) as competition has entered the market. Worst of all, EGHT has no profits to show for its jump-start.
Further casting doubt on EGHT’s ability to meet the expectations baked into its stock price, the firms aggressive spending doesn’t appear to be slowing down. Year-over-year R&D and sales & marketing expense has outpaced YoY revenue growth for the past three years, while YoY general & administrative expense outpaced YoY revenue growth in two of the past three years. In order to grow the top line at rates that meet market expectations, EGHT is sacrificing the bottom line and masking that sacrifice behind non-GAAP numbers.
Most alarming, the current share price already implies that EGHT is and will be wildly profitable for many years into the future. Given the litany of competition, EGHT’s current negative profitability, and the spending required to now fight large incumbents, it’s clear EGHT faces an uphill battle.
The largest risk to the bear case is what we call “stupid money risk”, which is higher in today’s low growth (organic) environment. Another firm could step in and acquire EGHT at a value that is much higher than the current market price. As we’ll show below, only in the event a firm is willing to destroy shareholder value is EGHT worth more than its current share price.
Would A Competitor Acquire EGHT?
The biggest risk to our thesis is that an outside firm acquires EGHT at a value at or above today’s price. If the deterioration of operations above wasn’t enough, we’ll show below that EGHT is not an attractive acquisition target unless a buyer is willing to destroy significant shareholder value.
To begin, EGHT has liabilities of which investors may not be aware that make it more expensive than the accounting numbers suggest.
- $32 million in outstanding employee stock options (3% of market cap)
- $12 million in off-balance-sheet operating leases (1% of market cap)
After adjusting for this liability we can model multiple purchase price scenarios. Even in the most optimistic of scenarios, EGHT is worth less than the current share price.
Figures 4 and 5 show what we think Cisco (CSCO) should pay for EGHT to ensure it does not destroy shareholder value. Cisco, along with many other tech giants, is rapidly expanding its cloud offerings and acquiring EGHT could allow the combined firms additional cross selling opportunities and a greater sales footprint. However, there are limits on how much CSCO would pay for EGHT to earn a proper return, given the NOPAT or free cash flows being acquired.
Each implied price is based on a ‘goal ROIC’ assuming different levels of revenue growth. In each scenario, the estimated revenue growth rate in year one equals the consensus estimate for 2017 (21%). For the subsequent years, we use 21% in scenario one because it represents a continuation of 2017 expectations. We use 25% in scenario two because it assumes a merger with Cisco could create additional revenue opportunities.
We conservatively assume that Cisco can grow EGHT’s revenue and NOPAT without spending on working capital or fixed assets. We also assume EGHT achieves a 10% NOPAT margin, which is the average of Cisco and 8×8’s current NOPAT margins. For reference, EGHT’s TTM NOPAT margin is -2%, so this assumption implies drastic and immediate improvement, but allows the creation of a truly best case scenario.
Figure 4: Implied Acquisition Prices For CSCO To Achieve 7% ROIC

Sources: New Constructs, LLC and company filings.
Figure 4 shows the ‘goal ROIC’ for CSCO as its weighted average cost of capital (WACC) or 7%. Even if 8×8 can grow revenue by 24% compounded annually with a 10% NOPAT margin for the next five years, the firm is not worth more than its current price of $14/share. Assuming the 24% scenario is a best-case view, Cisco would destroy nearly $175 million by purchasing EGHT at its current valuation. It’s also worth noting that any deal that only achieves a 7% ROIC would be only value neutral and not accretive, as the return on the deal would equal CSCO’s WACC.
Figure 5: Implied Acquisition Prices For CSCO To Achieve 17% ROIC

Sources: New Constructs, LLC and company filings.
Figure 5 shows the next ‘goal ROIC’ of 17%, which is CSCO’s current ROIC. Acquisitions completed at these prices would be truly accretive to CSCO shareholders. Even in the best-case growth scenario, the most Cisco should pay for EGHT is $5/share (62% downside). Assuming this best-case scenario, Cisco would destroy nearly $680 million by purchasing EGHT at its current valuation. Any scenario below 24% CAGR would result in further capital destruction. Furthermore, any deal above $5/share would lower CSCO’s ROIC, thereby destroying shareholder value.
As A Standalone Firm, Shares Are Overvalued
EGHT is up 19% year-to-date and 72% over the past two years, which easily surpasses the S&P’s gains over the same time frames. This price appreciation without a subsequent increase in the fundamentals of EGHT’s business has left shares significantly overvalued. To justify the current price of $14/share, EGHT must achieve 5% pretax margins (average since 2011, compared to -3% TTM) and grow revenue by 25% compounded annually for the next 15 years. In this scenario, EGHT would be generating nearly $6 billion in revenue 15 years from now, which is greater than highly profitable companies like Juniper Networks (NYSE:JNPR) and NVIDIA’s (NASDAQ:NVDA) last fiscal year revenue.
Even if we assume EGHT can achieve 5% pretax margins and grow revenue by 16% compounded annually for the next decade, the stock is only worth $4/share today – a 71% downside.
Each of these scenarios also assumes the company is able to grow revenue and NOPAT without spending on working capital or fixed assets, an assumption that is unlikely, but allows us to create a very optimistic scenario. For reference, EGHT’s invested capital has grown on average $19 million yearly (9% of 2016 revenue) over the past five years
Catalyst: EGHT’s Revenue Growth Façade Disappears
The market has proven time and time again that it’s willing to overlook losses as long as revenue growth soars. Management teams recognize and exploit this trend to distract investors from poor economics/cash flow. Nevertheless, the market is not willing to overlook losses forever and when momentum tech/cloud type stocks like EGHT run out of steam, the resulting damage can be drastic.
As shown above, even in the most optimistic scenarios, the profit growth already baked into EGHT remains overly optimistic. Any slip up in top line growth or cracks in the growth story will lead investors to re-evaluate and could result in EGHT’s valuation sinking to more rational levels.
Another, albeit smaller, concern is the overall health of the global economy. Firms may be less willing to undergo shifts in their communication structure while economic growth remains low.
Instability across Europe could provide headwinds to EGHT’s business operations, as the company has expanded operations to the region in recent years (2% of sales in 2014 compared to 12% of sales in 2016). Any prolonged issues related to the “brexit” or other financial woes could further impact margins, which are already negative.
Insider Action and Short Interest Is Low
Over the past 12 months 66 thousand insider shares have been purchased and 141 thousand have been sold for a net effect of 75 thousand insider shares sold. These sales represent <1% of shares outstanding. Additionally, there are 2.5 million shares sold short, or just over 3% of shares outstanding.
Impact of Footnotes Adjustments and Forensic Accounting
In order to derive the true recurring cash flows, an accurate invested capital, and a real shareholder value, we made the following adjustments to 8×8’s 2016 10-K:
Income Statement: we made $4 million of adjustments with a net effect of removing $2 million in non-operating expenses (1% of revenue). We removed $3 million related to non-operating expenses and $1 million related to non-operating income. See all adjustments made to EGHT’s income statement here.
Balance Sheet: we made $273 million of adjustments to calculate invested capital with a net decrease of $140 million. The most notable adjustment was $50 million (18% of net assets) related to asset write-downs. See all adjustments to EGHT’s balance sheet here.
Valuation: we made $200 million of adjustments with a net effect of increasing shareholder value by $112 million. The largest adjustment was the addition of $156 million (13% of market cap) due to excess cash. Despite increasing shareholder value, EGHT remains overvalued.
Dangerous Funds That Hold EGHT
The following funds receive our Dangerous-or-worse rating and allocate significantly to 8×8.
- PowerShares S&P SmallCap Utilities (NASDAQ:PSCU) – 4.5% allocation and Dangerous rating.
- iShares U.S. Telecommunications ETF (NYSE:IYZ) – 3.6% allocation and Very Dangerous rating.
- ProShares Ultra Telecommunications (NYSE:LTL) – 3.6% allocation and Very Dangerous rating.
- Fidelity Select Telecommunications Fund (FTUTX) – 2.3% allocation and Very Dangerous rating.
Disclosure: David Trainer and Kyle Guske II receive no compensation to write about any specific stock, style, or theme.
