
EUR/USD - European Session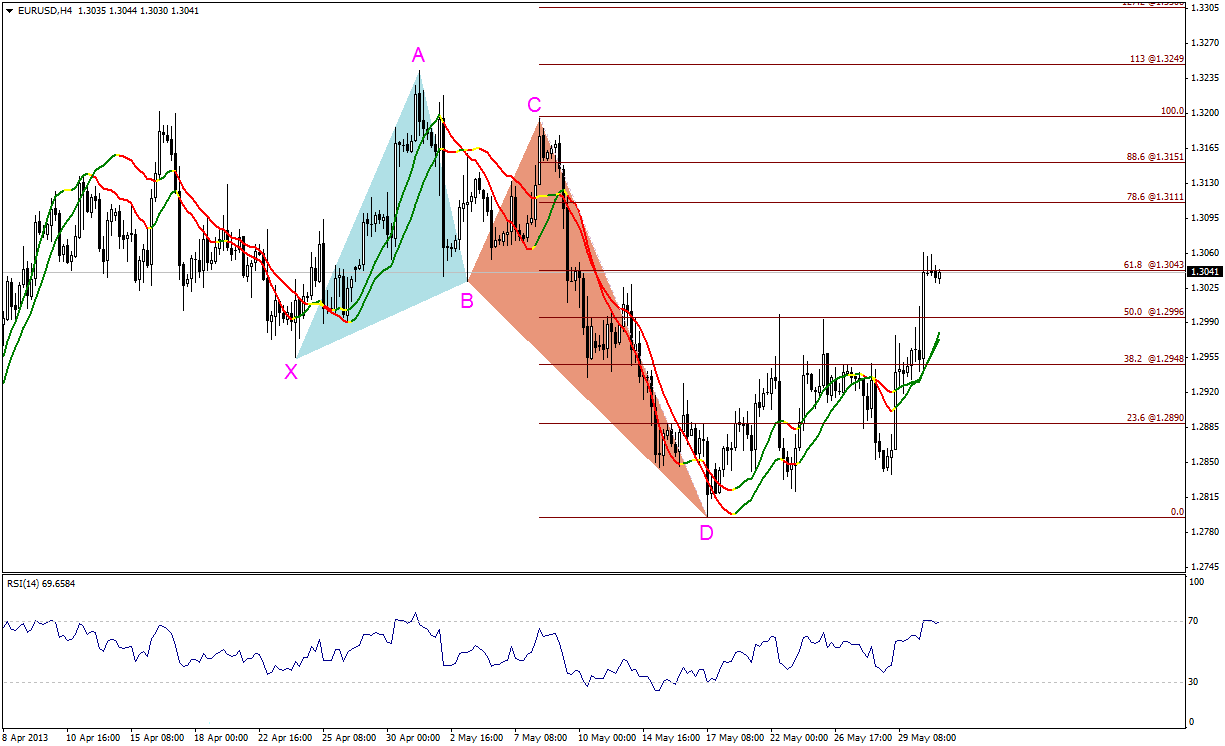 EUR/USD" title="EUR/USD" width="1225" height="746">
The EUR/USD rose sharply on Thursday, and managed to touch the second target of the bullish harmonic Butterfly Pattern at 61.8% correction around 1.3045. We can see now some volatility and perhaps bearish correction, but trading above 1.2950 is positive now, and might push the pair towards testing 78.6% correction and 886%, residing at 1.3110 and 1.3150.
The trading range is among the key support at 1.2950 and key resistance at 1.3150.
The general trend over short term basis is to the downside, targeting 1.2560 as far as areas of 1.3270 remain intact.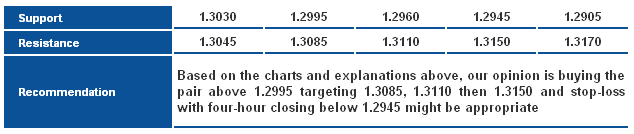 EUR/USD_S&R" title="EUR/USD_S&R" width="634" height="134">
GBP/USD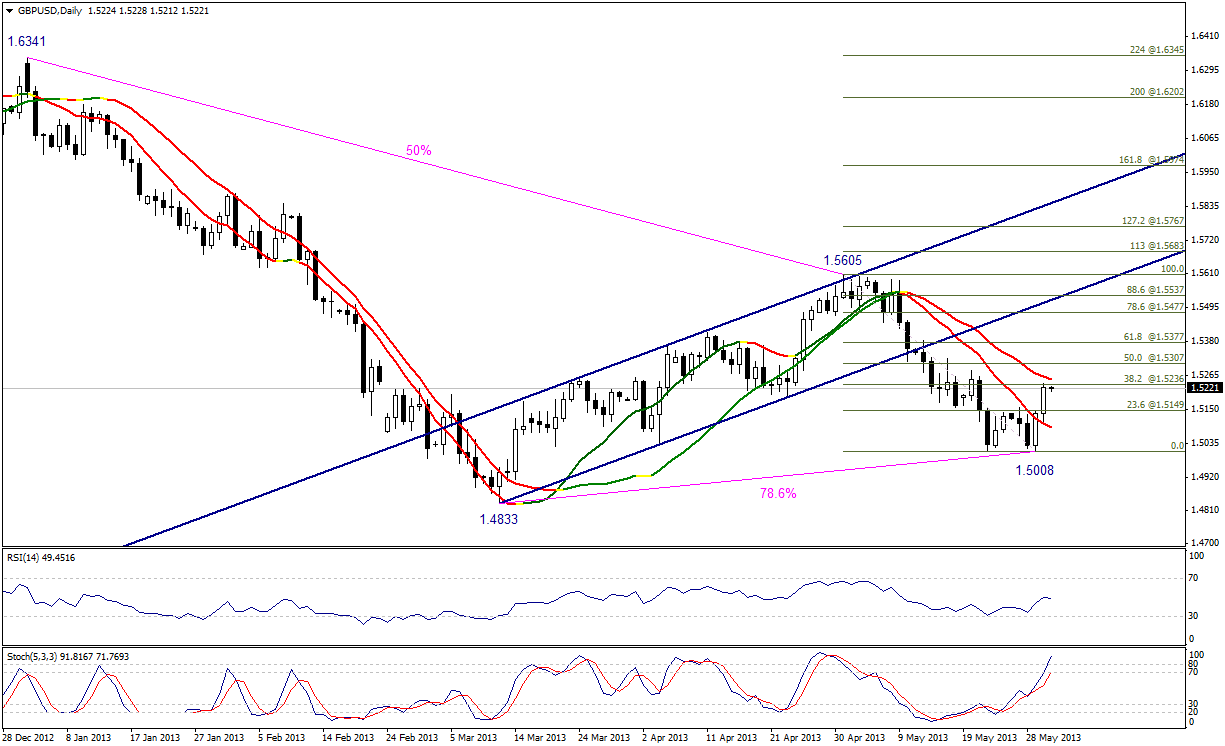 GBP/USD" title="GBP/USD" width="1225" height="746">
The GBP/USD pair touched 38.2% correction at 1.5235 on Thursday after consolidating above 1.5150 represented in 23.6% correction. Some volatility is possible due to overbought signals shown on Stochastic, as trading above 1.5150 is now positive.
The trading range is among key support at 1.5080 and key resistance at 1.5385.
The general trend over short term basis is to the downside, as far as areas of 1.5770 remains intact targeting 1.4355.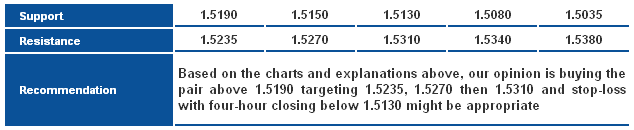 GBP/USD_S&R" title="GBP/USD_S&R" width="634" height="130">
USD/JPY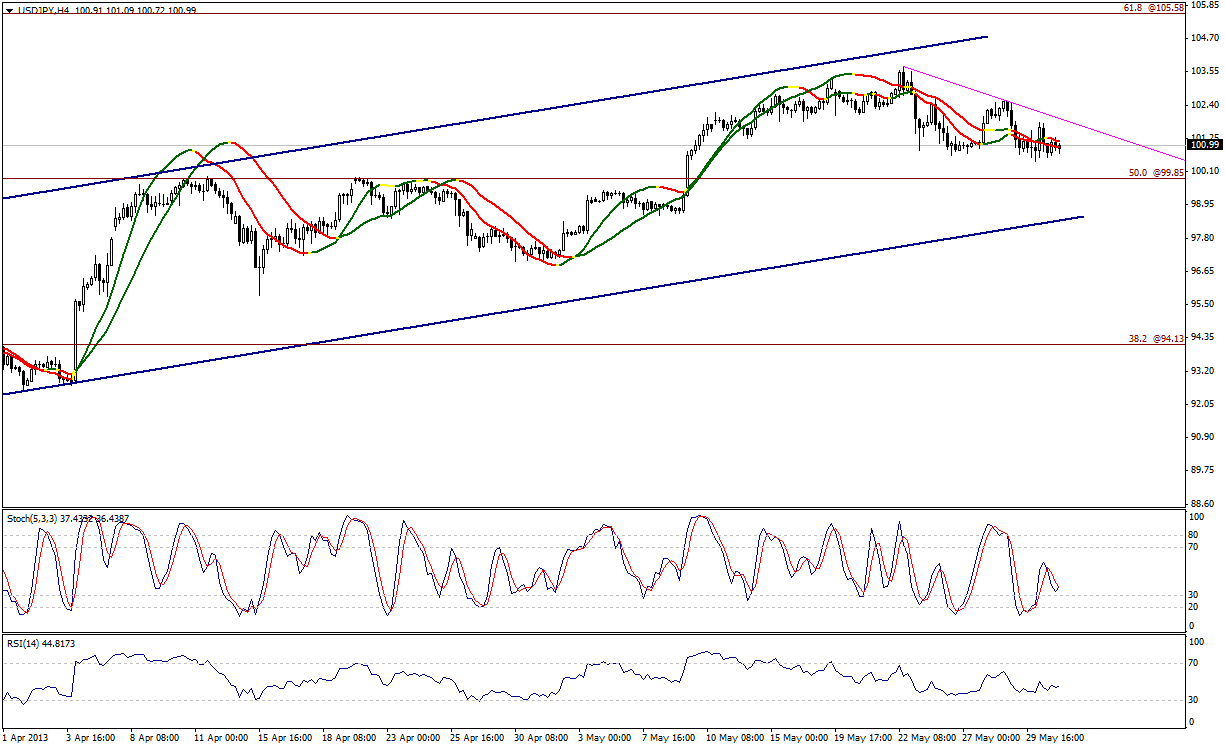 USD/JPY" title="USD/JPY" width="1225" height="746">
The USD/JPY pair’s attempt to the upside on Thursday remained limited below 102.00, bringing negativity back. We find the possibility of extending the intraday downside move valid, especially that the pair is trading below 101.70. Breaching 102.00 still represents a catalyst, failing intraday negative expectations.
The trading range is among key support at 99.85 and key resistance at 102.50.
The general trend over short term basis is to the upside as far as areas of 96.50 remain intact, targeting 105.60.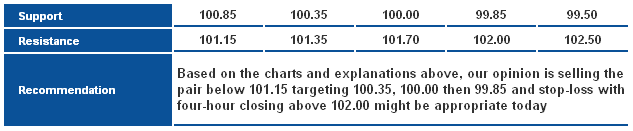 USD/JPY_S&R" title="USD/JPY_S&R" width="633" height="131">
USD/CHF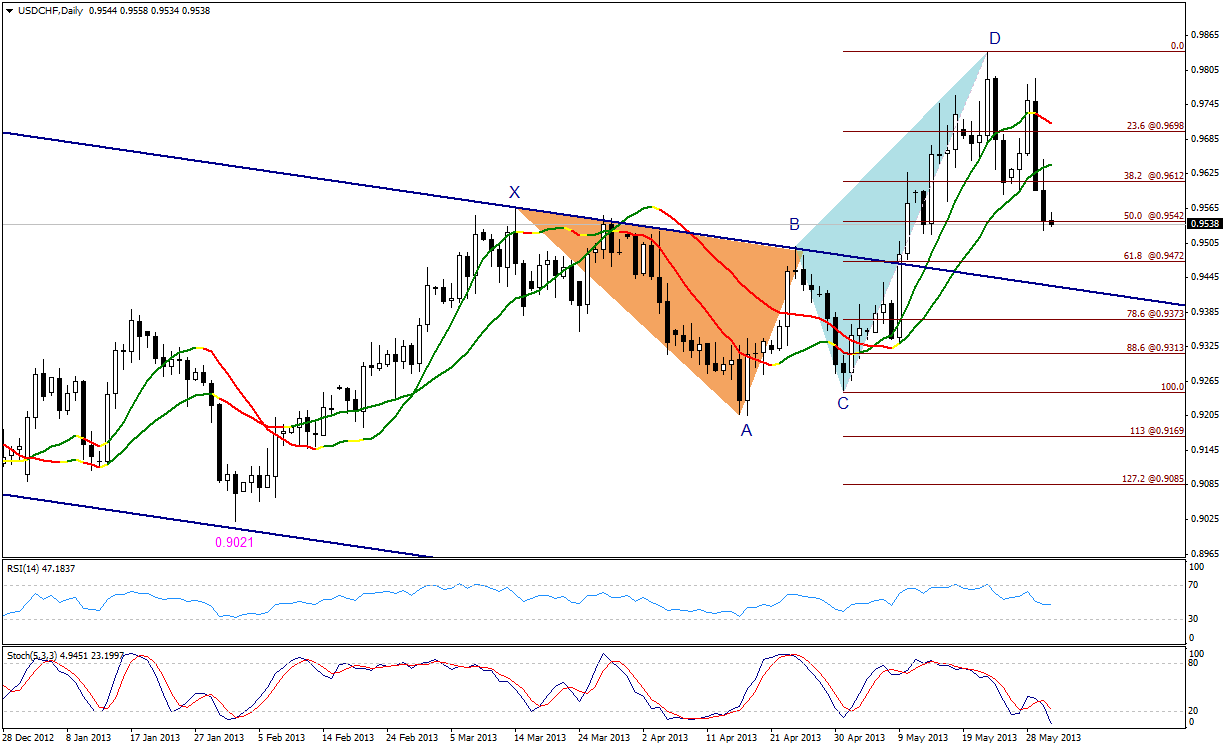 USD/CHF" title="USD/CHF" width="1225" height="746">
The USD/CHF pair extended the downside move affected by the bearish harmonic Butterfly Pattern, and is trading around 50 correction of CD Leg of the pattern, below 38.2% correction at 0.9610. Based on the technical harmonic analysis rules, trading above the first target of the pattern represented in the referred to 38.2% correction might extend the downside move towards the second target at least at 0.9470 represented in 61.8%. Linear Regression Indicator 34 is negative. The RSI tends to the downside, supporting our negative expectations.
The trading range is among key support at 0.9400 and key resistance at 0.9650.
The general trend over short term basis is to the downside, stable at levels 0.9775 targeting 0.8860.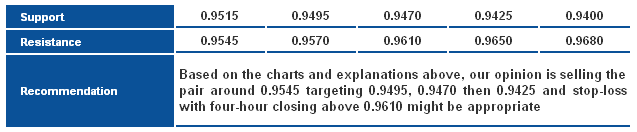 USD/CHF_S&R" title="USD/CHF_S&R" width="637" height="132">
USD/CAD USD/CAD" title="USD/CAD" width="730" height="460">
The USD/CAD pair dropped for the second session running, but did not exceed 130 pips from this week’s top. The drop did not break 1.0270. We think that the bullish move might return soon, especially as the pair is closer to Linear Regression Indicators that are trading positively.
The trading range is between the key support at 1.0215, and the key resistance at 1.0540.
The general trend over short term basis is to the upside, with steady daily closing above levels 0.9800 targeting 1.0485.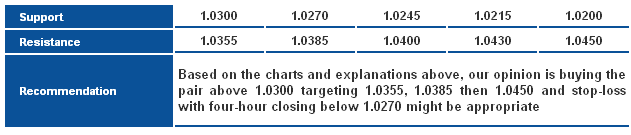 USD/CAD_S&R" title="USD/CAD_S&R" width="637" height="132">
AUD/USD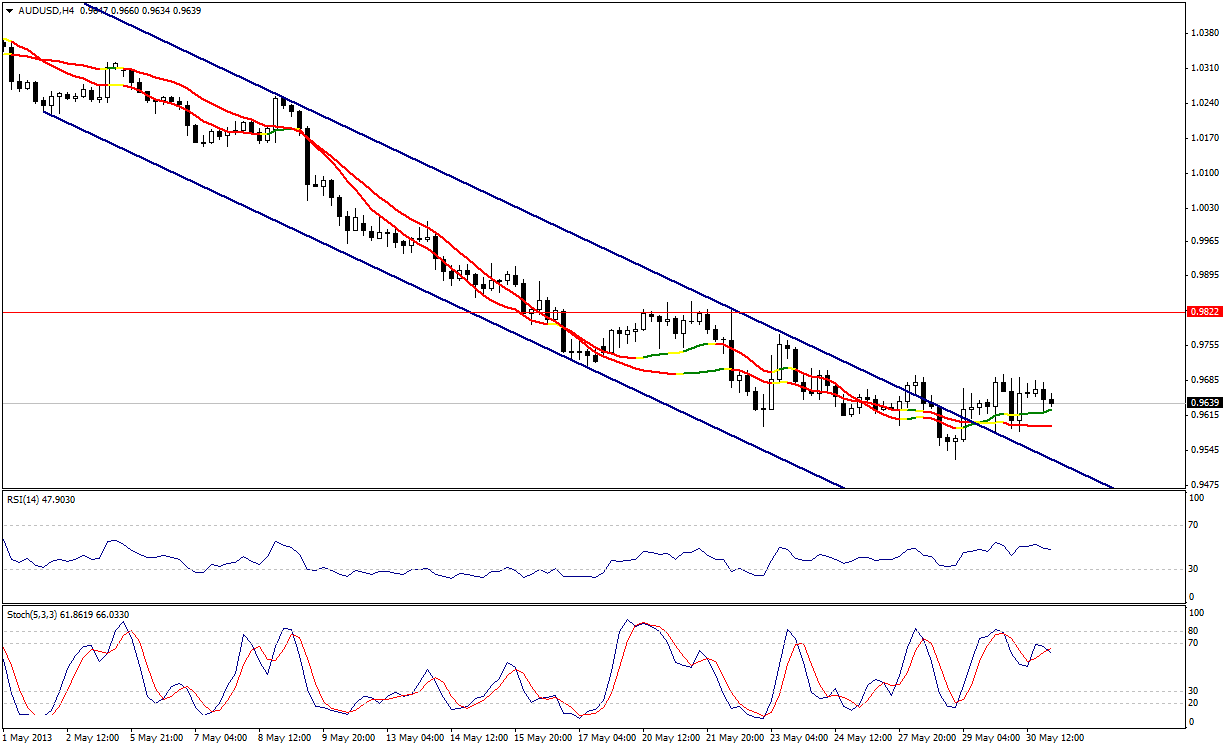 AUD/USD" title="AUD/USD" width="1225" height="746">
The AUD/USD assumed sideways trading, and despite steadying above the bearish channel's resistance it didn't manage to confirm a breach to 0.9690. Stabilizing above that level is required to prove the return of the uptrend, but residing below linear regression indicators prevents us from suggesting a downtrend.
Expected trading range expected is between the key support at 0.9495 and the key resistance 0.9825.
Short-term trend is downside, targeting 0.9400 if 1.0710 remains intact.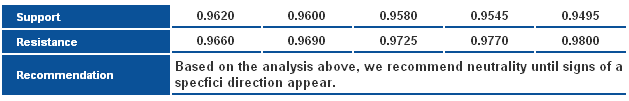 AUD/USD_S&R" title="AUD/USD_S&R" width="629" height="101">
NZD/USD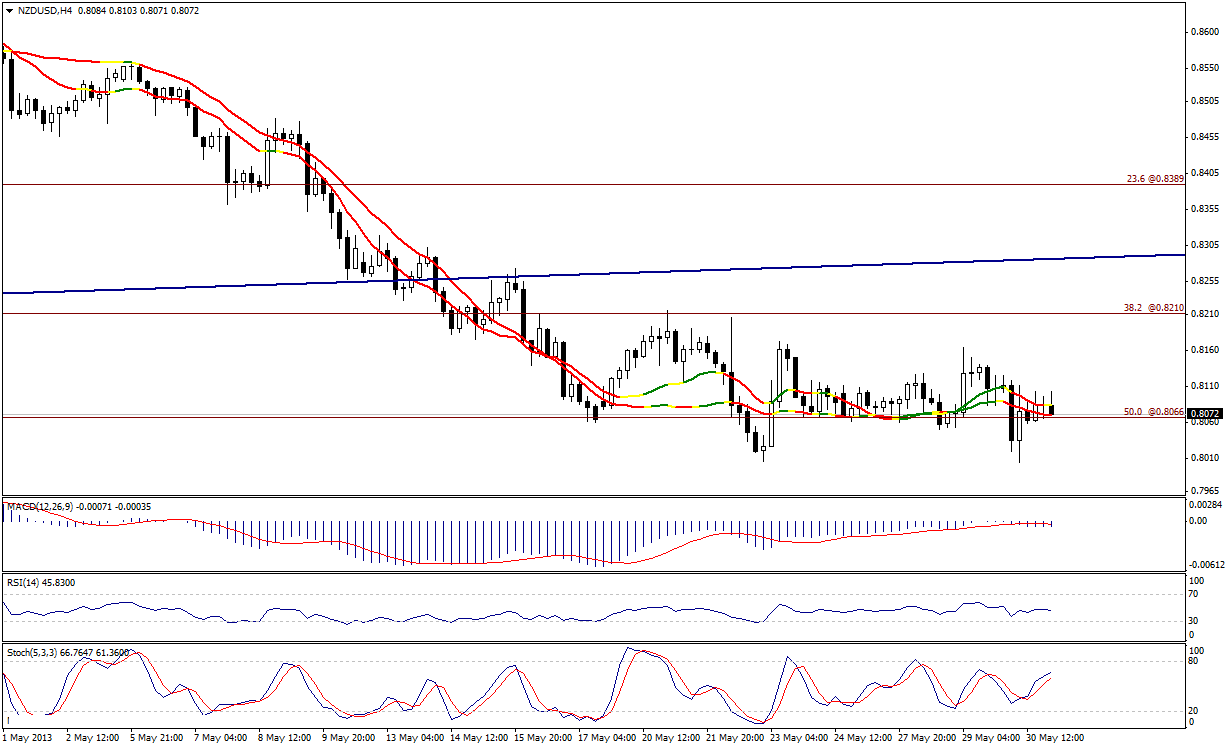 NZD/USD" title="NZD/USD" width="1225" height="746">
The NZD/USD is hovering around 50% correction at 08065. The pair didn't manage to particularly stabilize above it, especially since it broke that level on Thursday, and returned above it. The relative strength index is trading in a sideways bias , below the 50-point line. Linear regression indicators are negative as well, but the pair is steady between LRI 34 and 55. Neutrality is the appropriate stance to assume until the pair offers better signs.
Expected trading range expected is between the key support at 0.7920 and the key resistance 0.8225.
Short-term trend is downside, targeting 0.7715 if 0.8400 remains intact.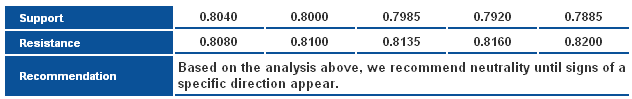 NZD/USD_S&R" title="NZD/USD_S&R" width="632" height="99">
- English (UK)
- English (India)
- English (Canada)
- English (Australia)
- English (South Africa)
- English (Philippines)
- English (Nigeria)
- Deutsch
- Español (España)
- Español (México)
- Français
- Italiano
- Nederlands
- Português (Portugal)
- Polski
- Português (Brasil)
- Русский
- Türkçe
- العربية
- Ελληνικά
- Svenska
- Suomi
- עברית
- 日本語
- 한국어
- 简体中文
- 繁體中文
- Bahasa Indonesia
- Bahasa Melayu
- ไทย
- Tiếng Việt
- हिंदी
Daily Technical Report: Major And Cross Currencies - May 31, 2013
Published 05/31/2013, 05:58 AM
Updated 07/09/2023, 06:31 AM
Daily Technical Report: Major And Cross Currencies - May 31, 2013
Latest comments
Loading next article…
Install Our App
Risk Disclosure: Trading in financial instruments and/or cryptocurrencies involves high risks including the risk of losing some, or all, of your investment amount, and may not be suitable for all investors. Prices of cryptocurrencies are extremely volatile and may be affected by external factors such as financial, regulatory or political events. Trading on margin increases the financial risks.
Before deciding to trade in financial instrument or cryptocurrencies you should be fully informed of the risks and costs associated with trading the financial markets, carefully consider your investment objectives, level of experience, and risk appetite, and seek professional advice where needed.
Fusion Media would like to remind you that the data contained in this website is not necessarily real-time nor accurate. The data and prices on the website are not necessarily provided by any market or exchange, but may be provided by market makers, and so prices may not be accurate and may differ from the actual price at any given market, meaning prices are indicative and not appropriate for trading purposes. Fusion Media and any provider of the data contained in this website will not accept liability for any loss or damage as a result of your trading, or your reliance on the information contained within this website.
It is prohibited to use, store, reproduce, display, modify, transmit or distribute the data contained in this website without the explicit prior written permission of Fusion Media and/or the data provider. All intellectual property rights are reserved by the providers and/or the exchange providing the data contained in this website.
Fusion Media may be compensated by the advertisers that appear on the website, based on your interaction with the advertisements or advertisers.
© 2007-2024 - Fusion Media Limited. All Rights Reserved.