
EUR/USD - European Session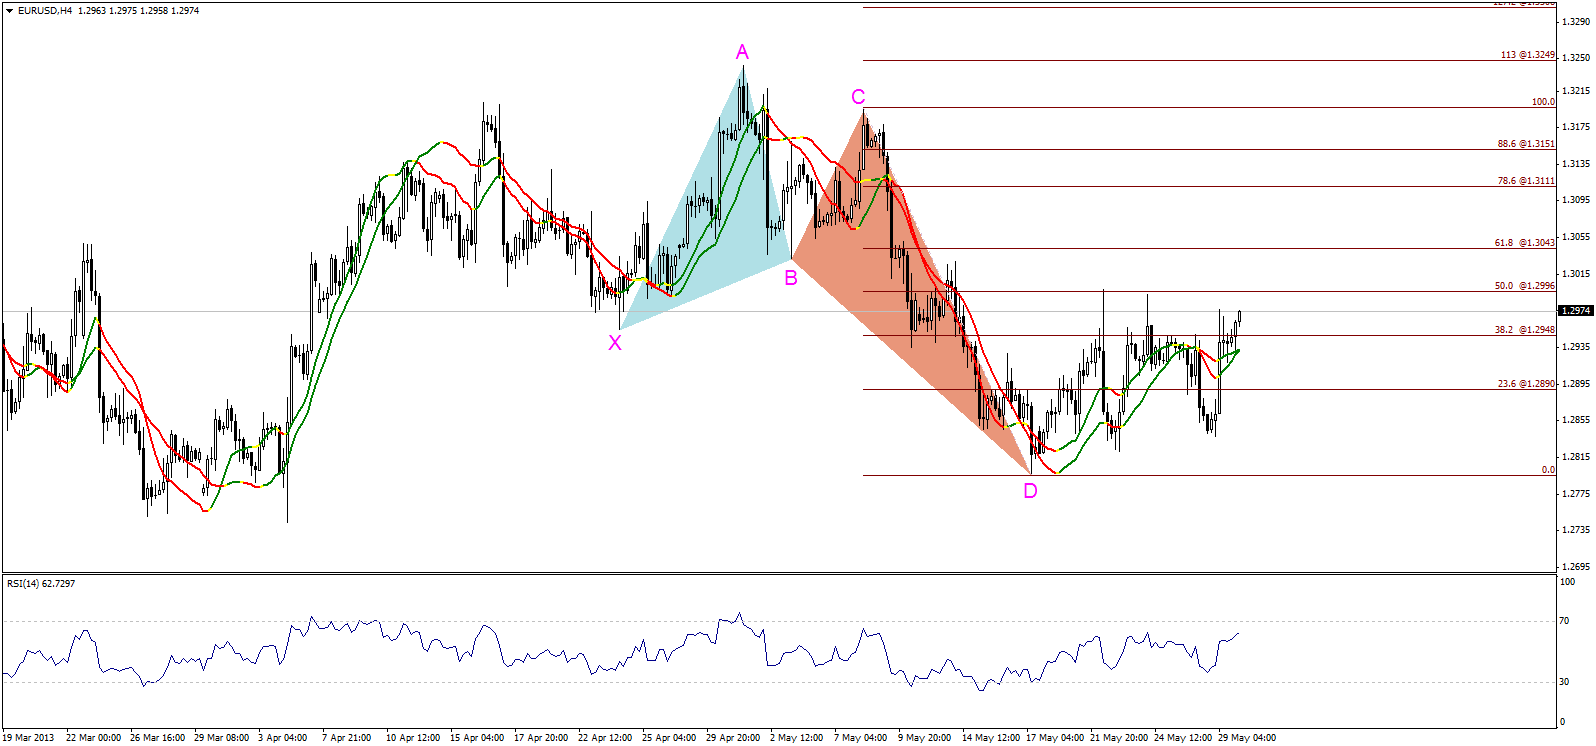 EUR/USD" title="EUR/USD" width="1596" height="746">
The pair moved to the upside and stabilized above the first target of the bullish harmonic Butterfly Pattern represented in 38.2% correction at 1.2950. This is now a significant support for the pair. Trading above it might extend the upside move towards the second target represented in 61.8% at 1.3045 levels. Linear Regression Indicators are positive again supporting our expectations.
The trading range for today is among the key support at 1.2870 and key resistance at 1.3085.
The general trend over short term basis is to the downside targeting 1.2560 as far as areas of 1.3270 remains intact.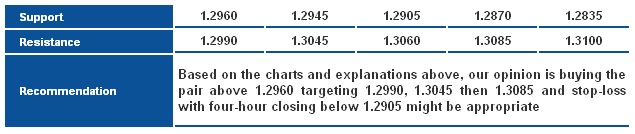 EUR/USD_S&R" title="EUR/USD_S&R" width="635" height="134">
GBP/USD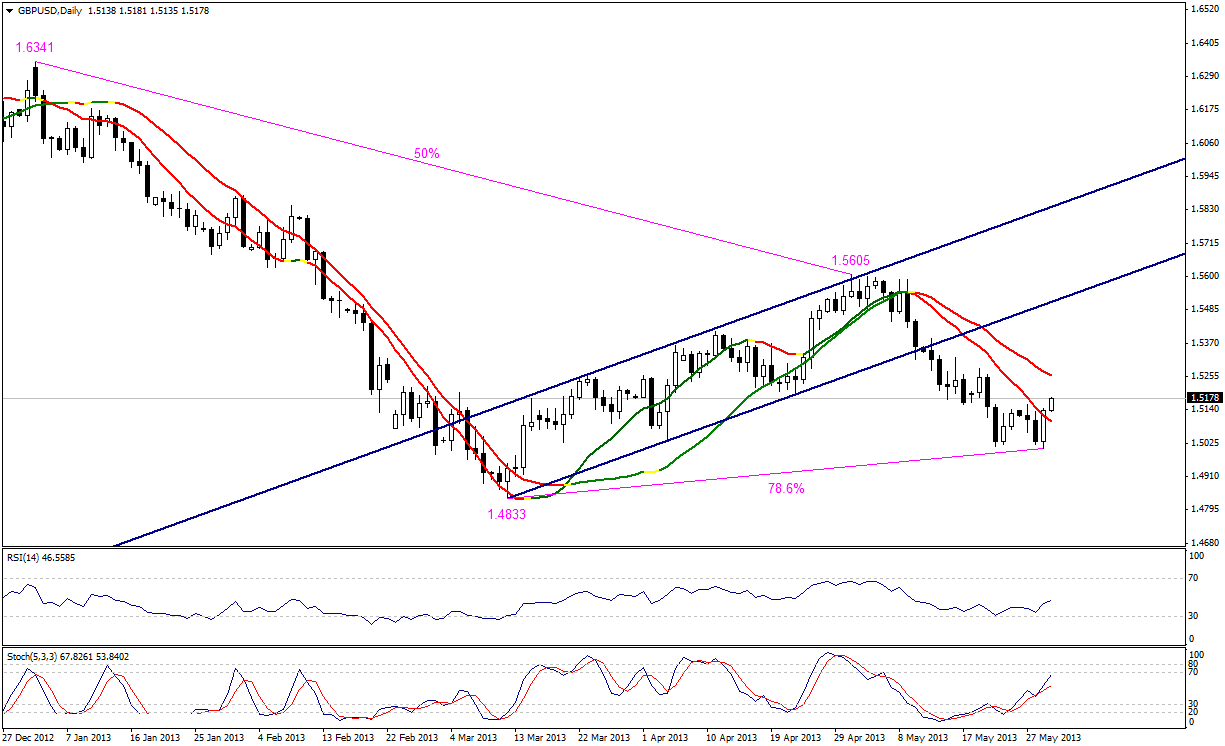 GBP/USD" title="GBP/USD" width="1225" height="746">
The pair entered a bullish wave whereas it failed to break 1.4995 several times and we see it stabilizing now above 1.5130 levels. The previous catalysts cause us to think that the pair has entered an upside move to test the previously broken ascending channel shown on the graph. Stability above the Linear Regression Indicator 34 weakens the pair’s response to the negativity of Linear Regression Indicators.
The trading range for today is among key support at 1.4825, and key resistance at 1.5130.
The general trend over short term basis is to the downside as far as areas of 1.5770 remain intact, targeting 1.4355.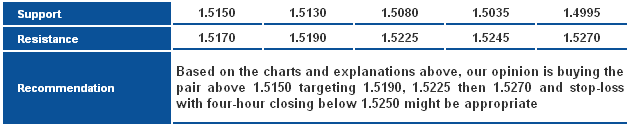 GBP/USD_S&R" title="GBP/USD_S&R" width="632" height="130">
USD/JPY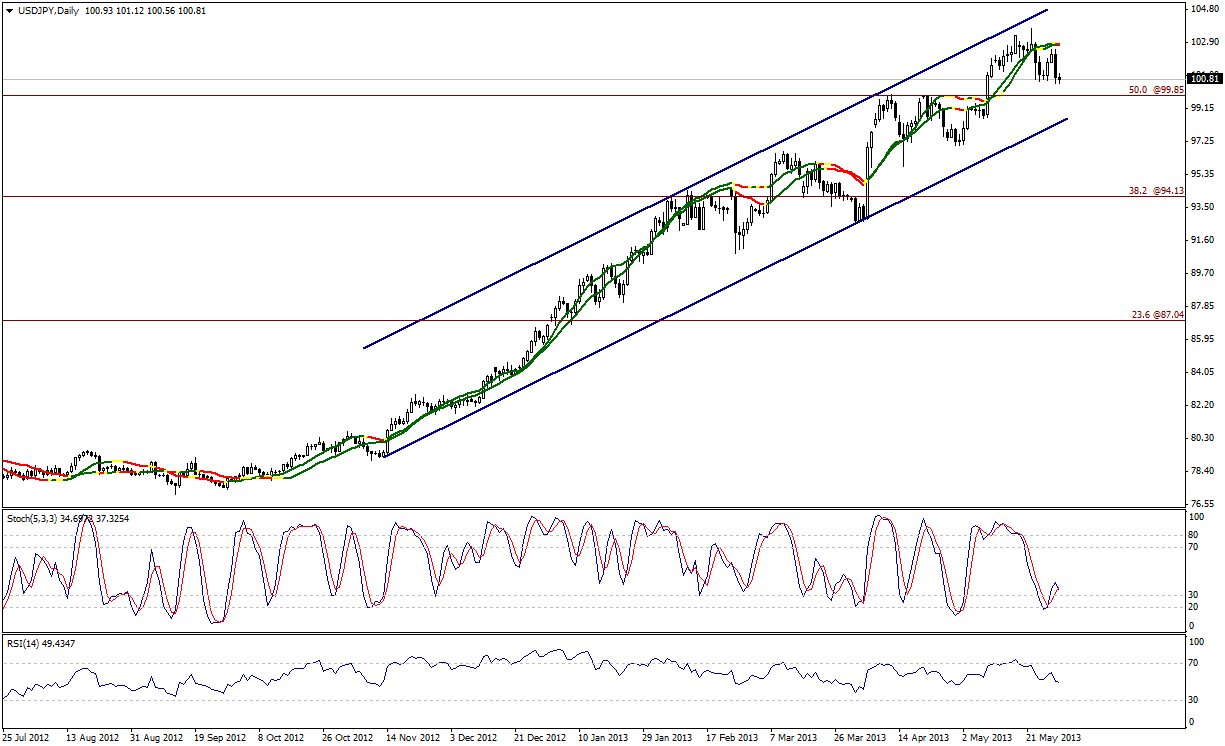 USD/JPY" title="USD/JPY" width="1225" height="746">
The pair is still trading negatively, and the downside move is likely to extend to retest 99.85 levels at least as previously mentioned. Despite the fact that Stochastic is trading close to oversold areas, it has crossed over negatively. The RSI is trading negatively, breaking line 50 to the downside.
The trading range for today is among key support at 99.85 and key resistance at 102.50.
The general trend over short term basis is to the upside as far as areas of 96.50 remain intact targeting 105.60.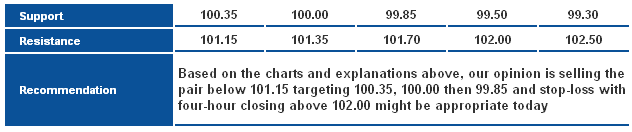 USD/JPY_S&R" title="USD/JPY_S&R" width="632" height="132">
USD/CHF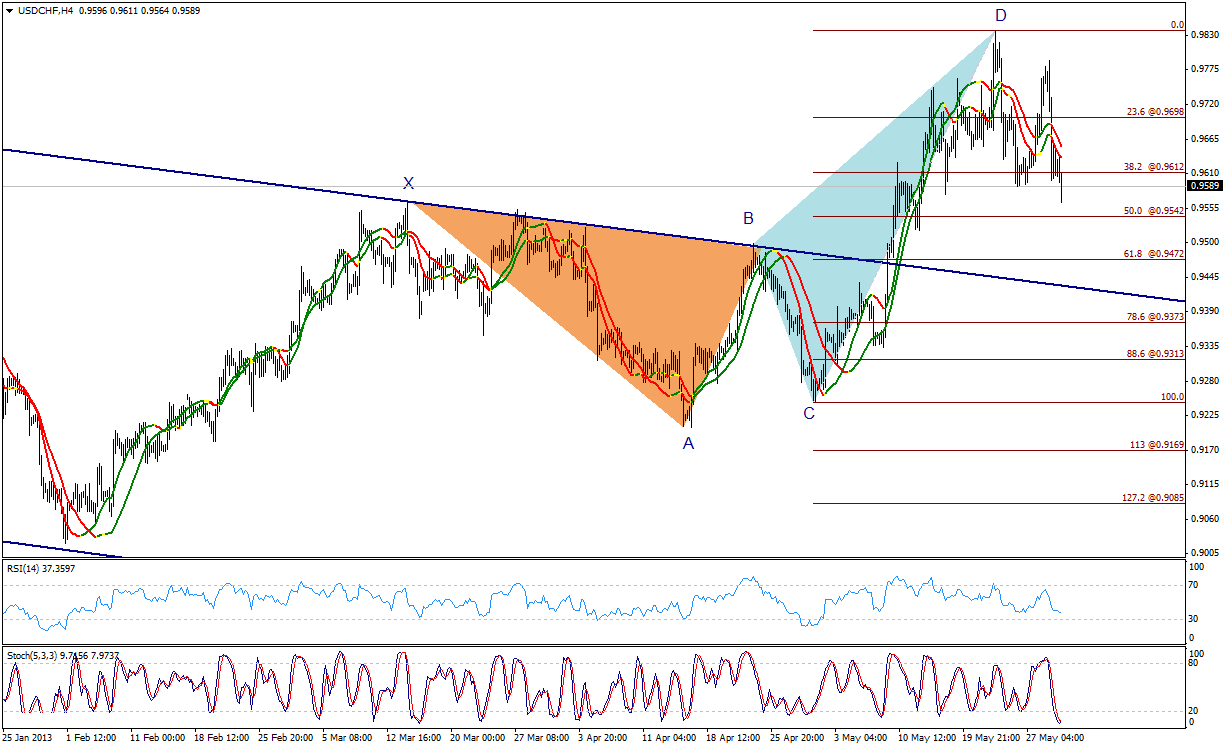 USD/CHF" title="USD/CHF" width="1225" height="746">
The pair dropped again affected by the bearish harmonic Butterfly Pattern and is currently trading below the first target at 0.9610, which might extend bearishness towards the second target residing at 0.9470, passing the 0.9540 levels represented in 50% and 61.8% Fibonacci. The possibility of a downside move remains strong by stability below 0.9610, but of the pair stabilized again above 0.9720 we should reconsider our outlook.
The trading range for today is among key support at 0.9470, and key resistance at 0.9700.
The general trend over short term basis is to the downside stable at levels 0.9775 targeting 0.8860.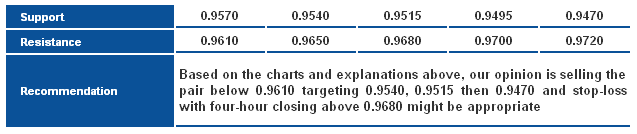 USD/CHF_S&R" title="USD/CHF_S&R" width="637" height="134">
USD/CAD USD/CAD" title="USD/CAD" width="730" height="460">
The pair dropped yesterday but failed to stabilize below 1.0300 levels keeping its positivity. Risk / Reward ratio is convenient again, suggesting an upside move that requires stability above 1.0270 levels.
The trading range for today is between the key support at 1.0215 and the key resistance at 1.0540.
The general trend over short term basis is to the upside, with steady daily closing above levels 0.9800 targeting 1.0485.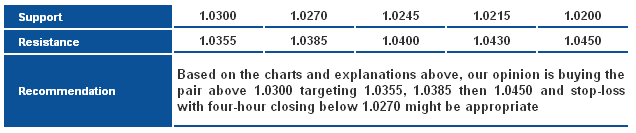 USD/CAD_S&R" title="USD/CAD_S&R" width="636" height="133">
AUD/USD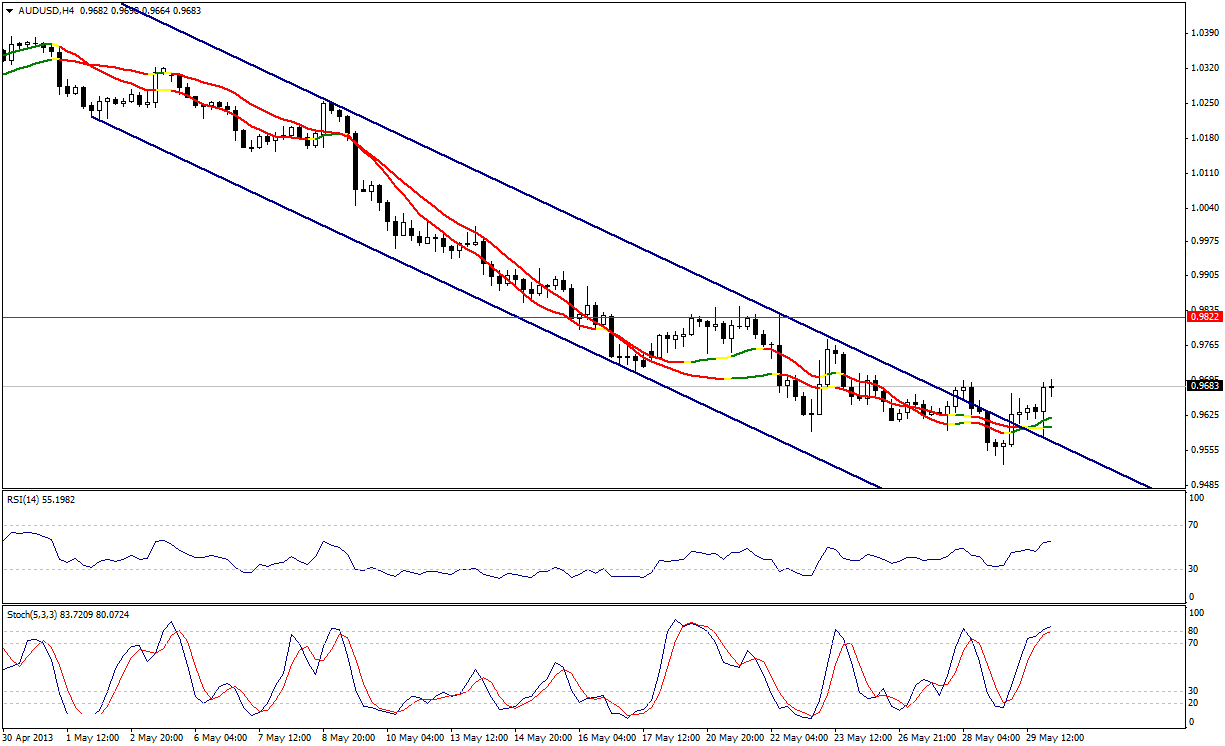 AUD/USD" title="AUD/USD" width="1225" height="746">
The AUD/USD steadied above the bearish channel's resistance and above linear regression indicators. Therefore, we believe we are ahead of an uptrend on Thursday's session and the period ahead. We believe the pair has commenced a bullish correction, and stability above 0.9690 supports our outlook.
**Trading range expected today is between the key support at 0.9600 and the key resistance 0.9825.
**Short-term trend is donwside targeting 0.9400 if 1.0710 remains intact.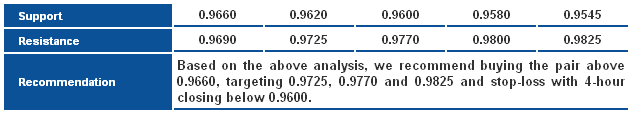 AUD/USD_S&R" title="AUD/USD_S&R" width="630" height="115">
NZD/USD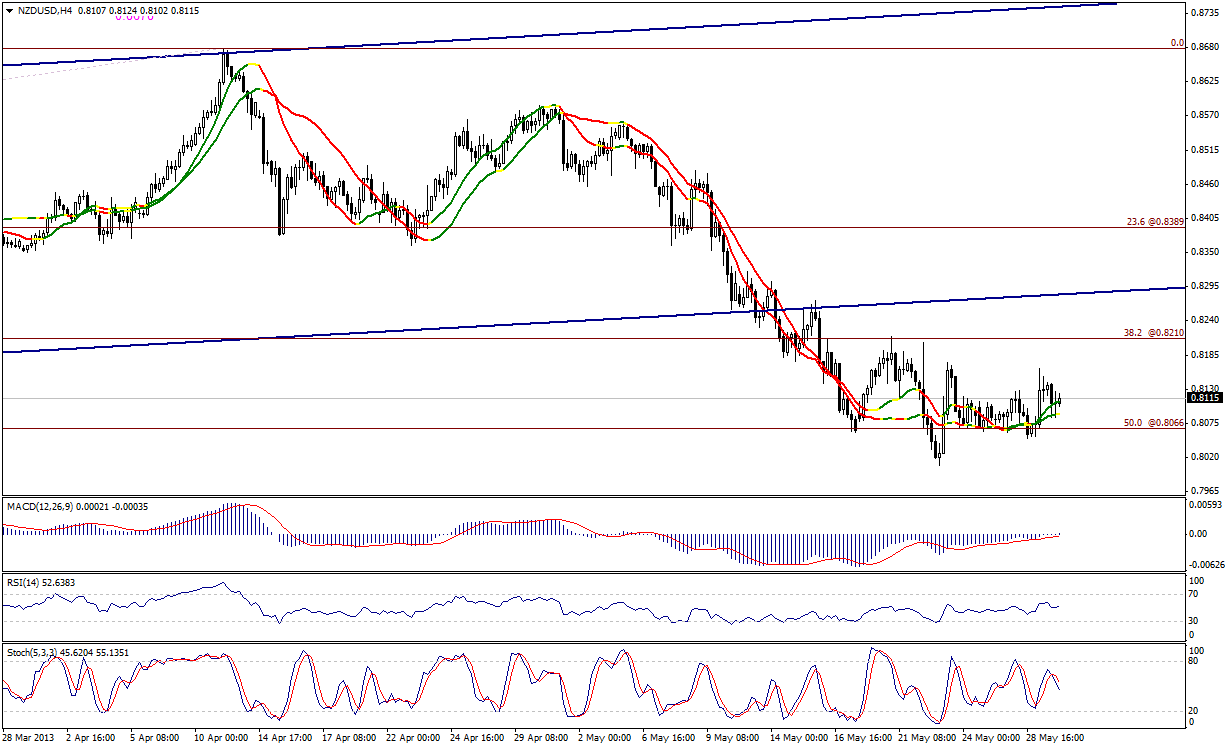 NZD/USD" title="NZD/USD" width="1225" height="746">
The NZD/USD is stable still above 0.8065 in conjunction with positivity of linear regression indicators, while the MACD attempts a bullish breach to the zero-point line. The relative strength index is inclined to the upside. All these circumstances promote the occurrence an upside movement on Thursday. Note that stability above 0.8065 is paramount, as the Stochastic is reflecting a negative bias. In order to keep that negative signal inactive, the pair must steady above the aforesaid level.
**Trading range expected today is between the key support at 0.8000, and the key resistance 0.8280.
**Short-term trend is downside, targeting 0.7715 if 0.8400 remains intact.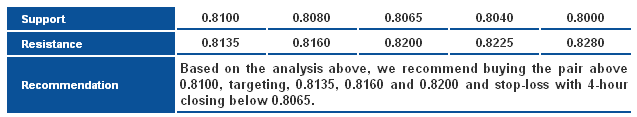 NZD/USD_S&R" title="NZD/USD_S&R" width="637" height="117">
- English (UK)
- English (India)
- English (Canada)
- English (Australia)
- English (South Africa)
- English (Philippines)
- English (Nigeria)
- Deutsch
- Español (España)
- Español (México)
- Français
- Italiano
- Nederlands
- Português (Portugal)
- Polski
- Português (Brasil)
- Русский
- Türkçe
- العربية
- Ελληνικά
- Svenska
- Suomi
- עברית
- 日本語
- 한국어
- 简体中文
- 繁體中文
- Bahasa Indonesia
- Bahasa Melayu
- ไทย
- Tiếng Việt
- हिंदी
Daily Technical Report: Major And Cross Currencies - May 30, 2013
Published 05/30/2013, 08:03 AM
Updated 07/09/2023, 06:31 AM
Daily Technical Report: Major And Cross Currencies - May 30, 2013
Latest comments
Loading next article…
Install Our App
Risk Disclosure: Trading in financial instruments and/or cryptocurrencies involves high risks including the risk of losing some, or all, of your investment amount, and may not be suitable for all investors. Prices of cryptocurrencies are extremely volatile and may be affected by external factors such as financial, regulatory or political events. Trading on margin increases the financial risks.
Before deciding to trade in financial instrument or cryptocurrencies you should be fully informed of the risks and costs associated with trading the financial markets, carefully consider your investment objectives, level of experience, and risk appetite, and seek professional advice where needed.
Fusion Media would like to remind you that the data contained in this website is not necessarily real-time nor accurate. The data and prices on the website are not necessarily provided by any market or exchange, but may be provided by market makers, and so prices may not be accurate and may differ from the actual price at any given market, meaning prices are indicative and not appropriate for trading purposes. Fusion Media and any provider of the data contained in this website will not accept liability for any loss or damage as a result of your trading, or your reliance on the information contained within this website.
It is prohibited to use, store, reproduce, display, modify, transmit or distribute the data contained in this website without the explicit prior written permission of Fusion Media and/or the data provider. All intellectual property rights are reserved by the providers and/or the exchange providing the data contained in this website.
Fusion Media may be compensated by the advertisers that appear on the website, based on your interaction with the advertisements or advertisers.
© 2007-2024 - Fusion Media Limited. All Rights Reserved.