
EUR/USD - European Session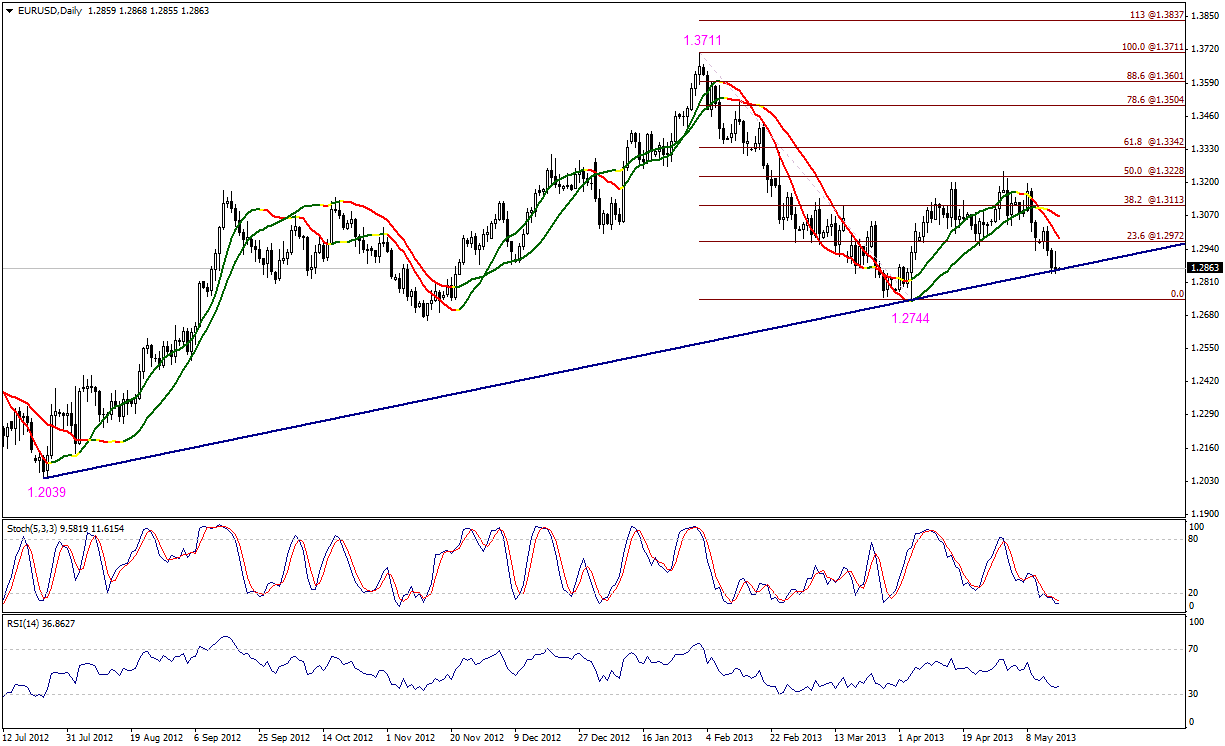 EUR/USD" title="EUR/USD" width="1225" height="746">
The pair moved to the upside on Thursday in some bullish correction as expected, but failed to hold on to its gains and dropped again. The pair is under negative pressure as the downside move might extend. Linear Regression Indicators are negative, supporting the possibility of bearishness unless levels 1.2970 arebreached.
The trading range for is among the key support at 1.2745 and key resistance at 1.2990.
The general trend over short term basis is to the downside targeting 1.2560 as far as areas of 1.3270 remains intact.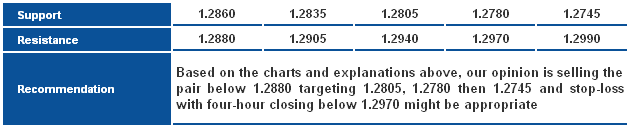 EUR/USD_S&R" title="EUR/USD_S&R" width="630" height="130">
GBP/USD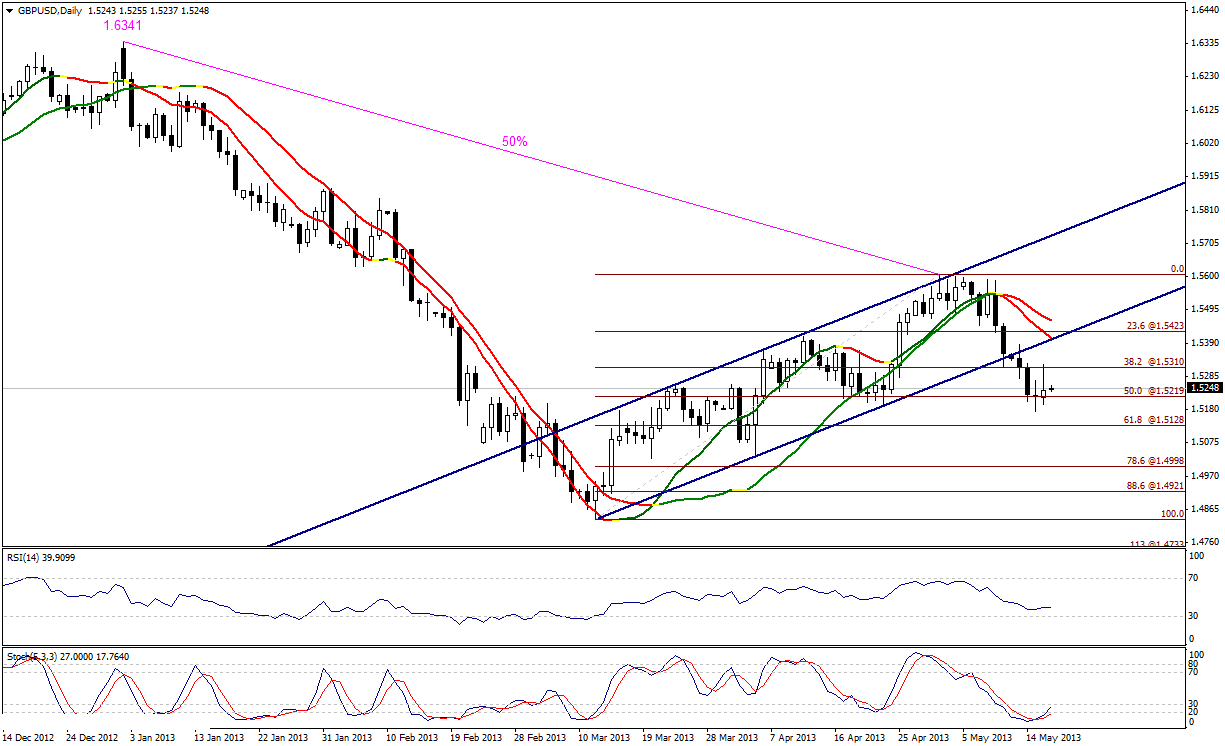 GBP/USD" title="GBP/USD" width="1225" height="746">
The pair achieved two of the suggested targets of the bullish correction. When the pair moved back to the downside, it remained limited above 1.5220. Stability above 1.5220 represented in 50% correction gives the possibility of moving to the upside again. Stochastic is showing a positive bias of the momentum, forcing us to expect another upside correction attempt. Breaking 1.5190 levels and stability below it might push the further to the downside.
The trading range is among key support at 1.5100 and key resistance at 1.5385.
The general trend over short term basis is to the downside as far as areas of 1.5770 remains intact targeting 1.4355.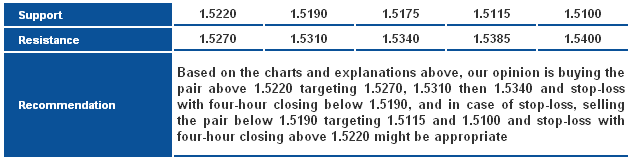 GBP/USD_S&R" title="GBP/USD_S&R" width="633" height="161">
USD/JPY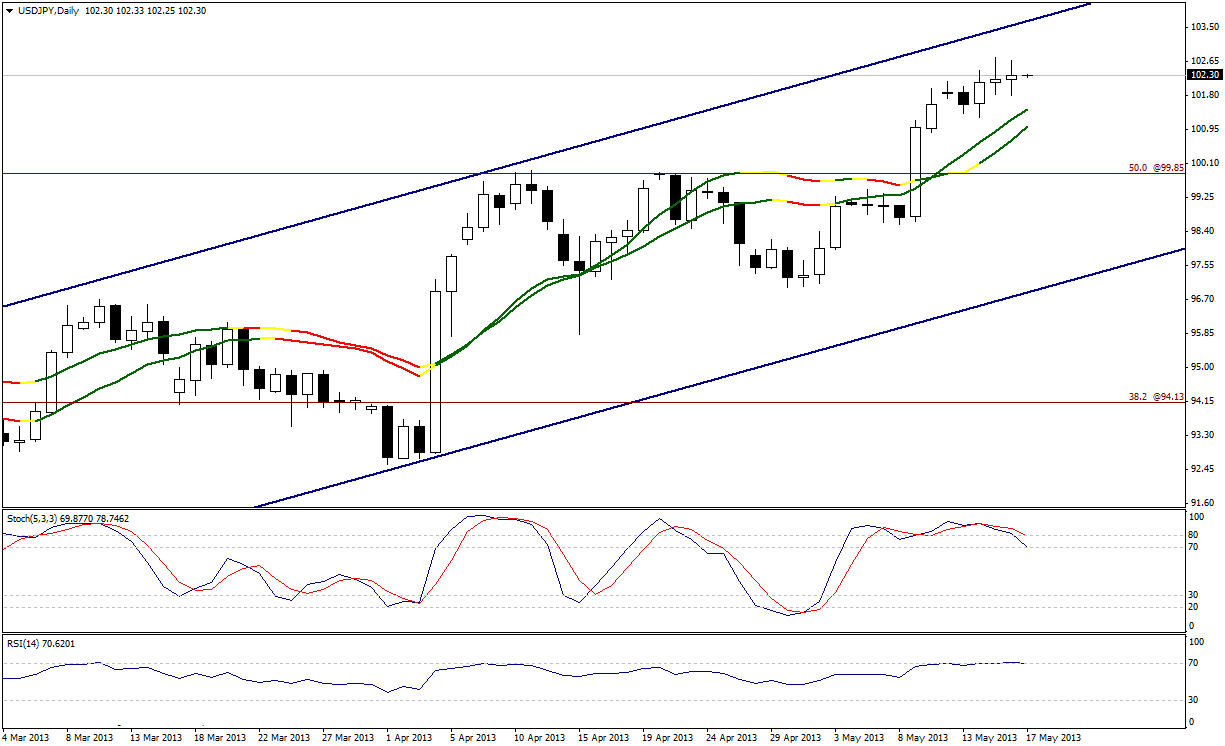 USD/JPY" title="USD/JPY" width="1225" height="746">
The pair is trading in a sideways range that tends to the upside, which is normal in light of stability above Linear Regression Indicators and being in an ascending channel. Stability above 102.15 forces us to expect an extension to the bullish move; this possibility remains valid by stabilizing above 101.70 during today’s session.
The trading range is among key support at 101.15 and key resistance at 103.75.
The general trend over short term basis is to the upside as far as areas of 96.50 remain intact targeting 105.60.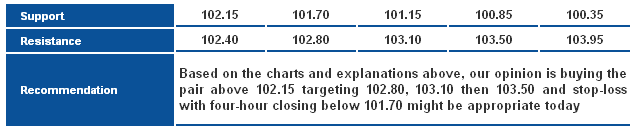 USD/JPY_S&R" title="USD/JPY_S&R" width="635" height="131">
USD/CHF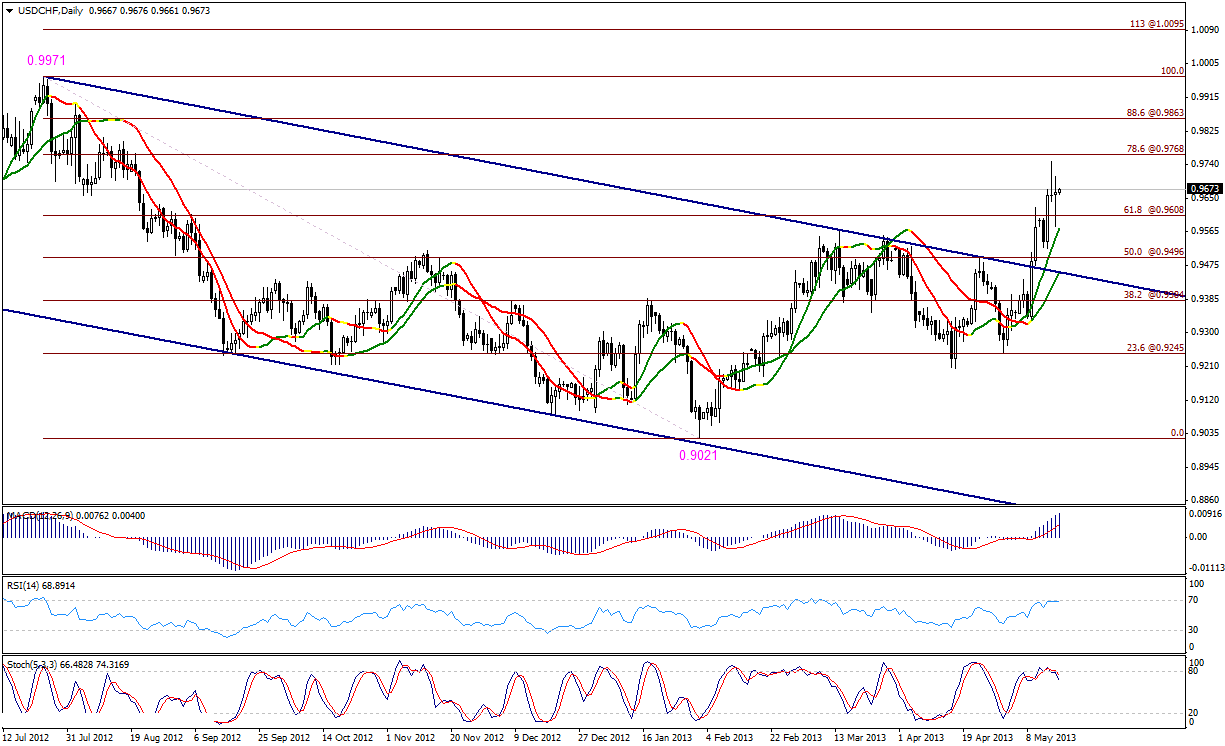 USD/CHF" title="USD/CHF" width="1225" height="746">
The pair is in great volatility, but managed to stay positive. Levels 0.9610 halted the bullish momentum and brought positivity back, we think that stability above 0.9610 is enough to keep our positive expectations. Watch the pair at around 0.9770 levels as they determine the trend.
The trading range is among key support at 0.9515 and key resistance at 0.9865.
The general trend over short term basis is to the downside stable at levels 0.9775 targeting 0.8860.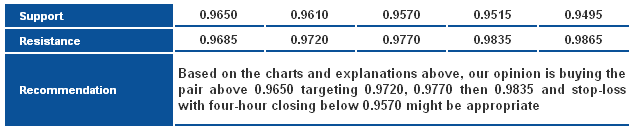 USD/CHF_S&R" title="USD/CHF_S&R" width="635" height="131">
USD/CAD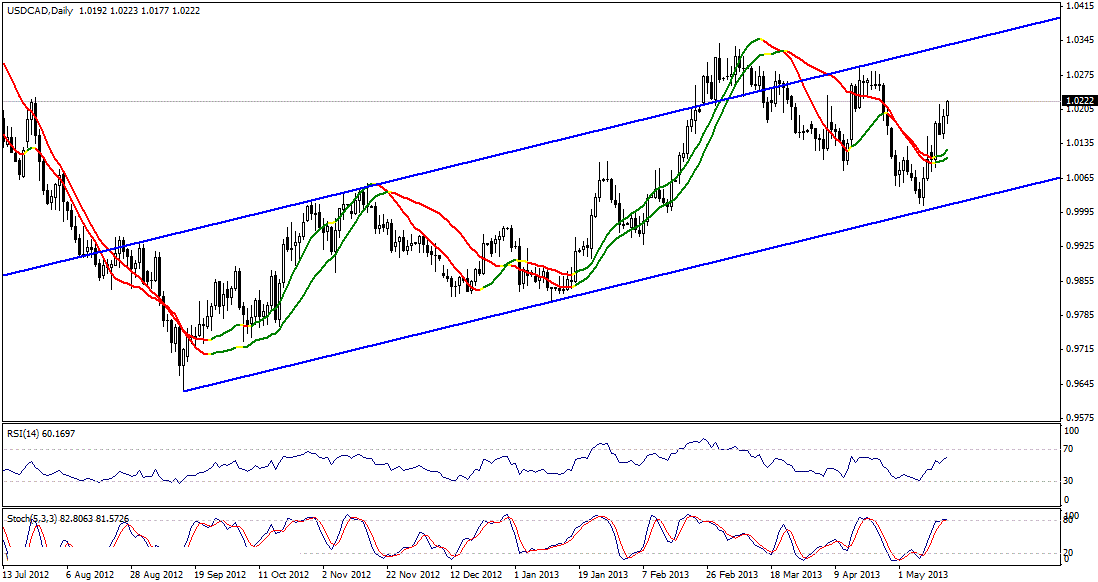 USD/CAD" title="USD/CAD" width="600" height="647">
The pair continued its upside rally and breached 1.0215 levels. Breaching 1.0215 levels increases positivity, and might extend the bullish move, as Linear Regression Indicators supports these expectations. Momentum indicators are showing intraday overbought signals, which make it necessary to stabilize above 1.0185 levels in order not to trigger the negative signals.
The trading range is between the key support at 1.0140 and the key resistance at 1.0355.
The general trend over short term basis is to the upside with steady daily closing above levels 0.9800 targeting 1.0485. USD/CAD_S&R" title="USD/CAD_S&R" width="635" height="131">
AUD/USD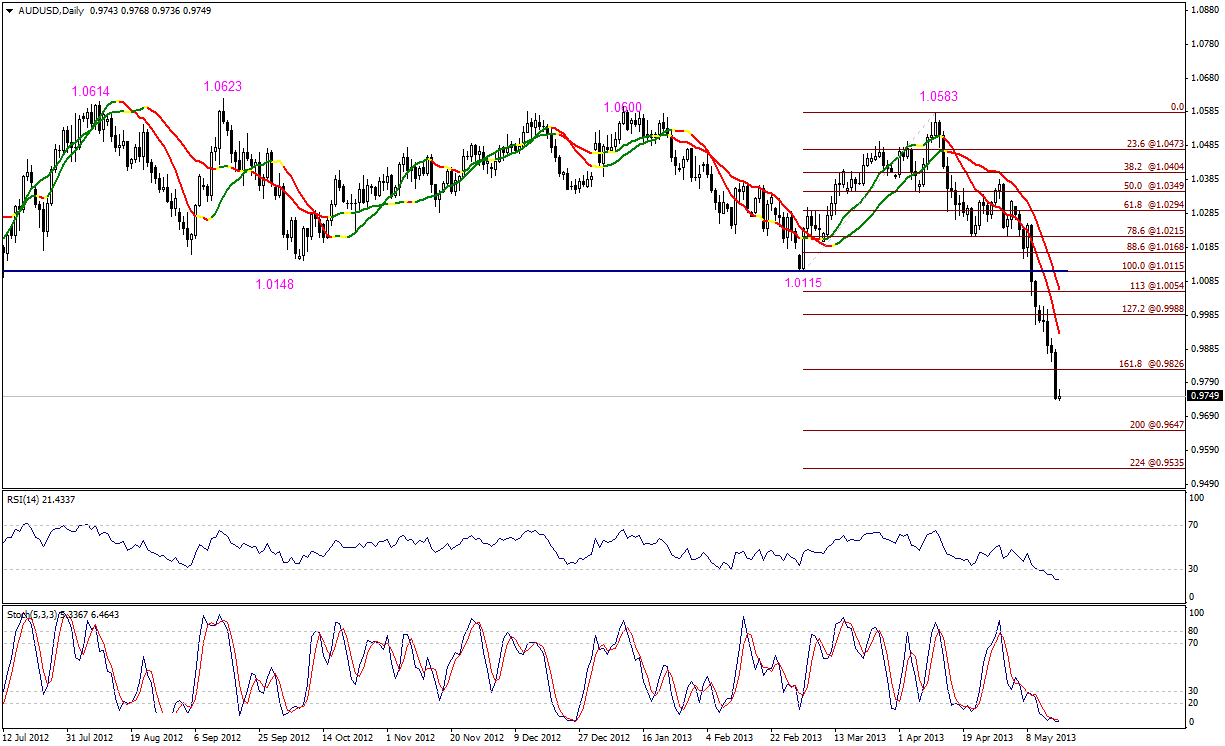 AUD/USD" title="AUD/USD" width="1225" height="746">
The AUD/USD's downtrend extended further after breaking 0.9825, or 161.8% Fibonacci. The bearish trend is expected to extend beyond that level 200% perhaps even to 224% Fibonacci at 0.9745 and 0.9535 respectively. Stability below 0.9825 is vital to maintain the proposed negative outlook.
Expected trading range is between the key support at 0.9670 and the key resistance 0.9935.
Short-term trend is donwside targeting 0.9400 if 1.0710 remains intact. AUD/USD_S&R" title="AUD/USD_S&R" width="636" height="115">
NZD/USD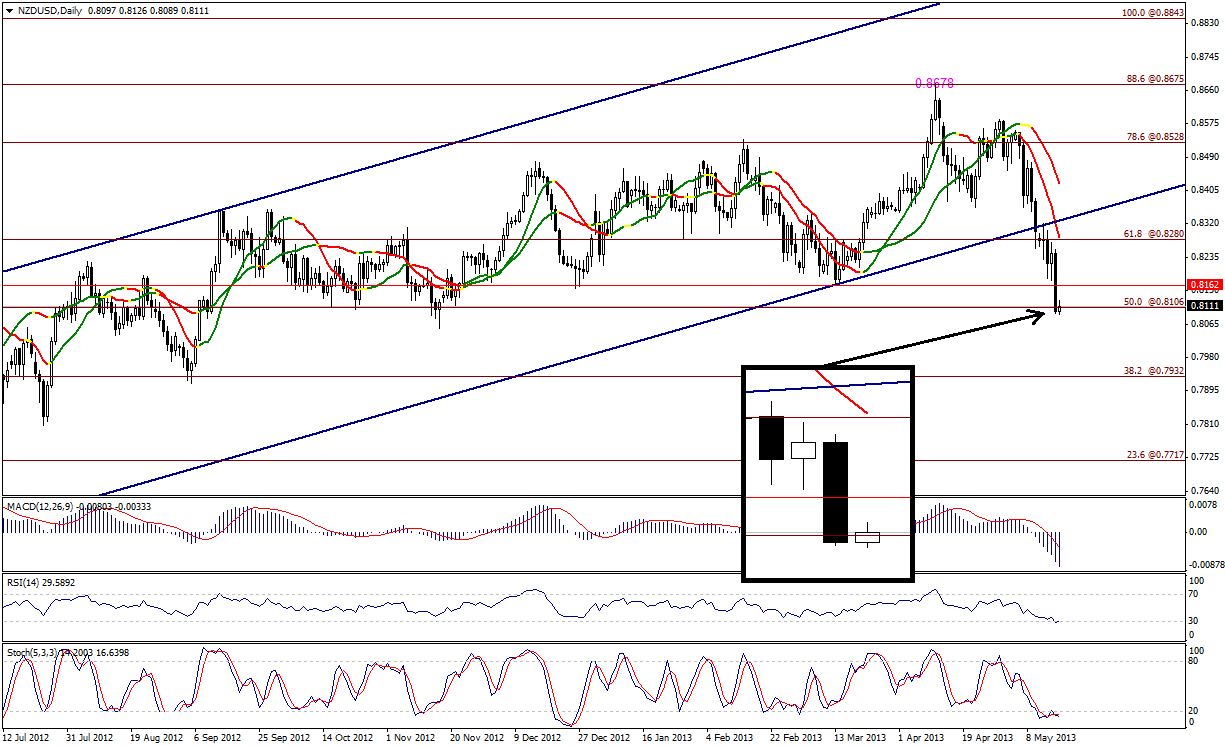 NZD/USD" title="NZD/USD" width="1225" height="746">
The NZD/USD plunged sharply on Thursday, closing a daily candlestick below 0.8105 as seen in the sub-image on the graph above. Breaking that level could cause the extension of the downtrend all the way to the psychological barrier at 0.8000, then conduct a potential attempt of touching 0.7930. Currently, and due to oversold sgnals reflected by momentum indicators, we need to see the pair stabilizing below 0.8160 to maintain bearish expectations.
Expected trading range expected is between the key support at 0.7930, and the key resistance 0.8225.
Short-term trend is bullish targeting 0.8845 if 0.8130 remains intact.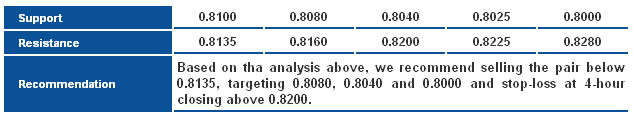 NZD/USD_S&R" title="NZD/USD_S&R" width="633" height="118">
GBP/JPY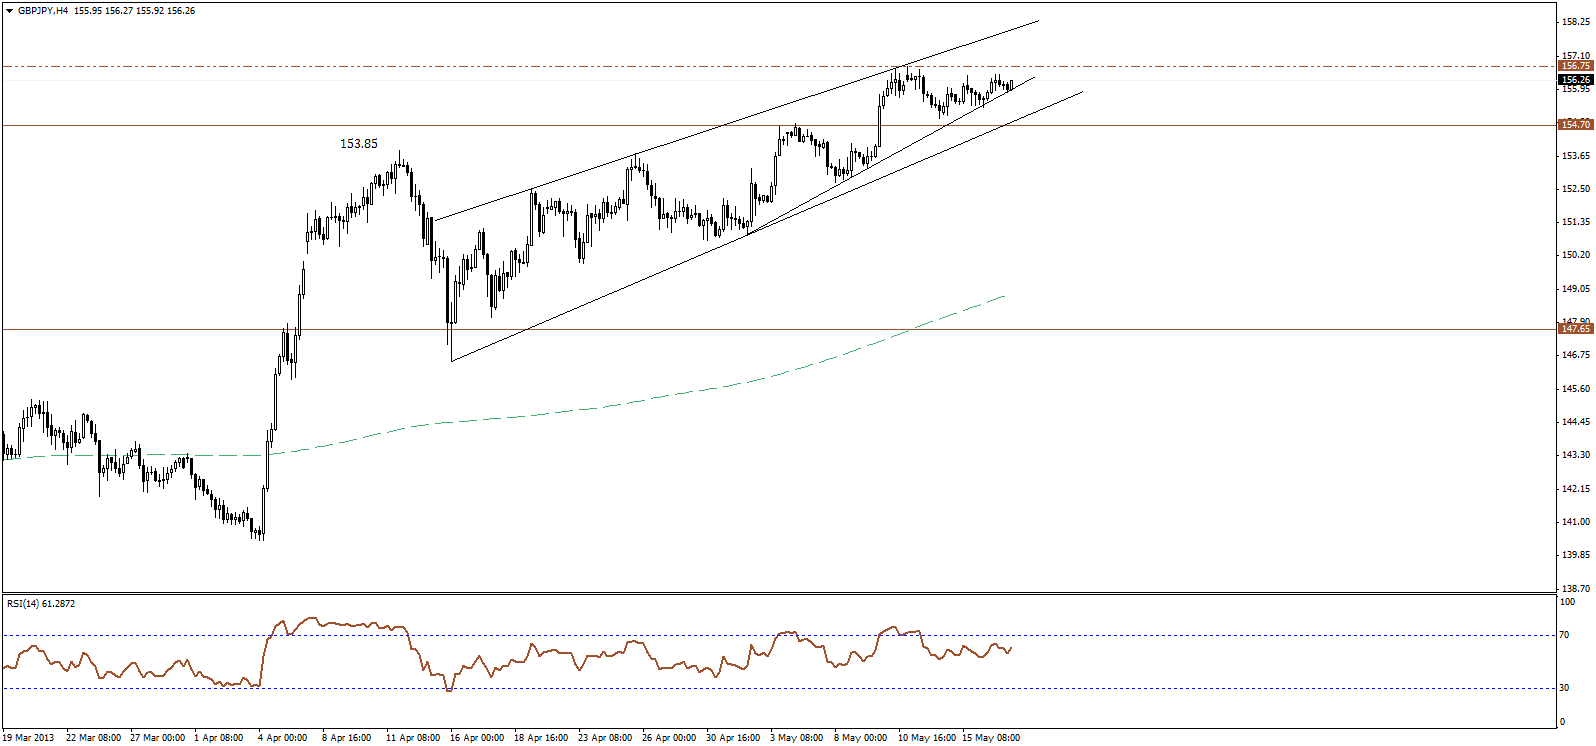 GBP/JPY" title="GBP/JPY" width="1596" height="746">
The GBP/JPY pair is gradually pushing higher, approaching the recent highs at 156.75. The short term bullish structure remains intact. We'll hold onto our bullish view unchanged.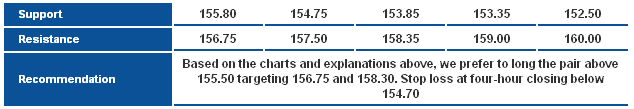 GBP/JPY_S&R" title="GBP/JPY_S&R" width="634" height="109">
EUR/JPY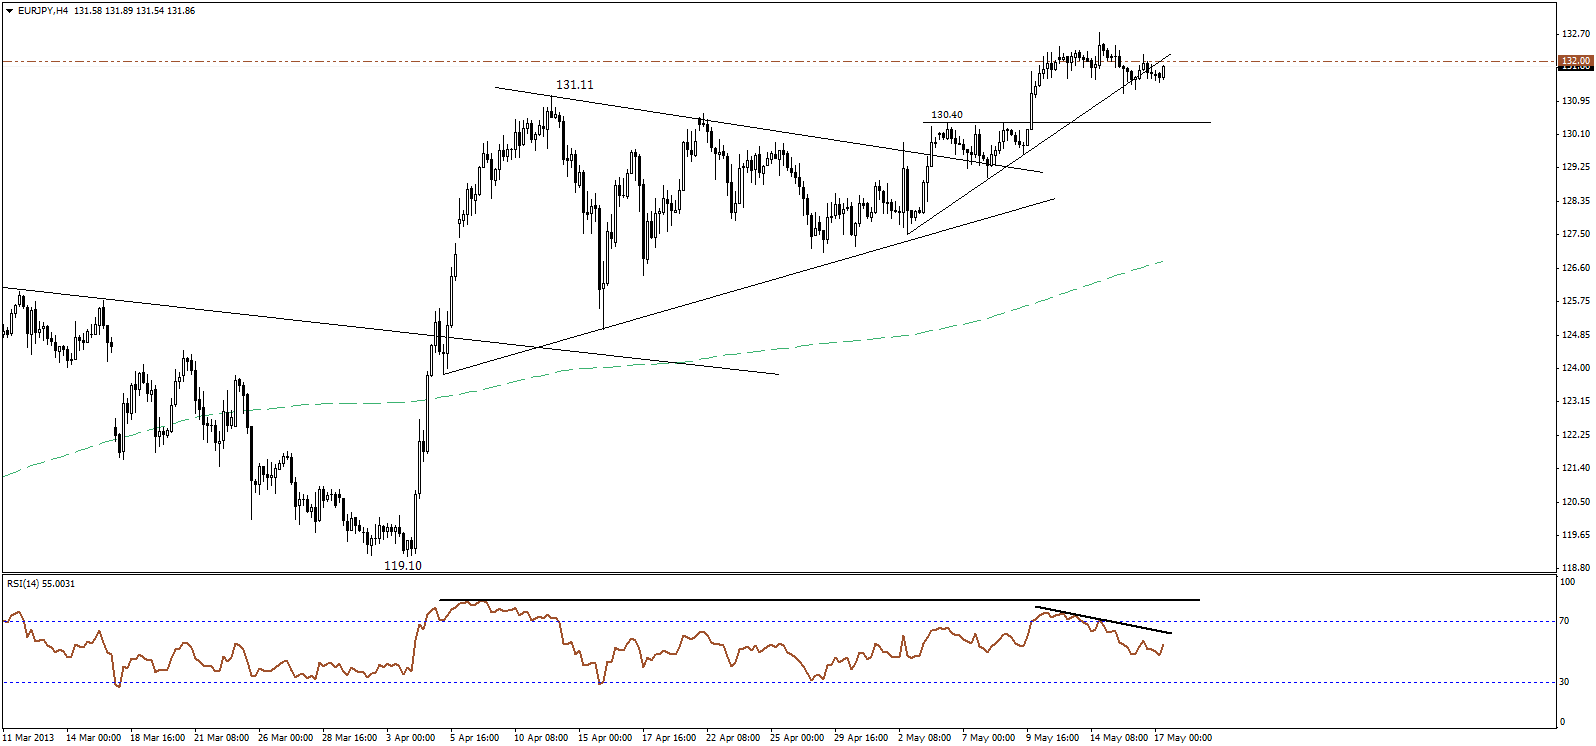 EUR/JPY" title="EUR/JPY" width="1596" height="746">
The EUR/JPY pair continues to fluctuate within a relatively tight range for the past few days, around the 132.00 level. The RSI is continuing to lose the bullish momentum. The pair has also broken the short term ascending support while moving sideways. We would like to see the RSI move higher again, while price breaks and hold above 132.00 and preferably 132.50 to confirm further upside. EUR/JPY_S&R" title="EUR/JPY_S&R" width="636" height="97">
EUR/GBP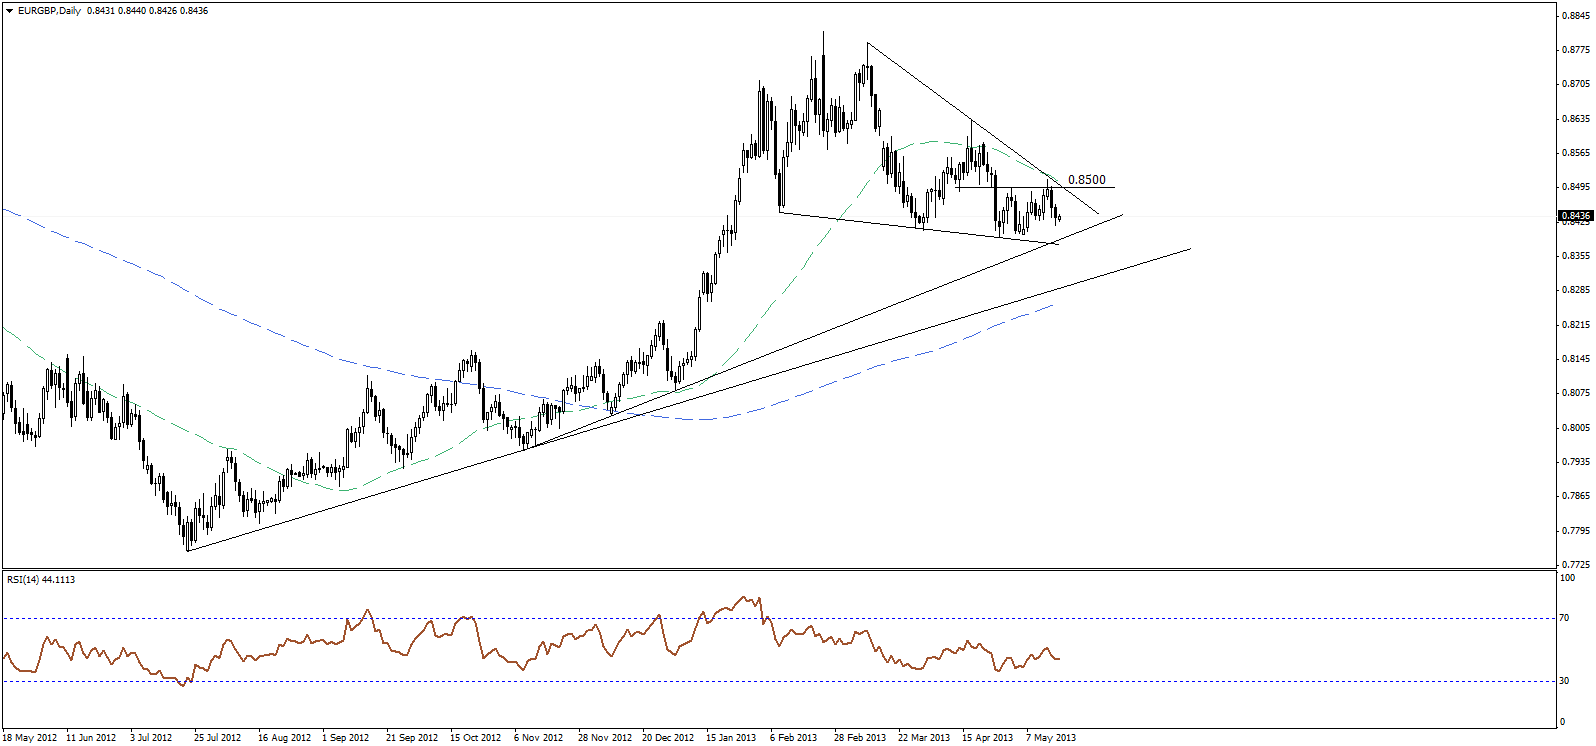 EUR/GBP" title="EUR/GBP" width="1596" height="746">
The EURGBP pair continued to move lower on Thursday, pushing towards 0.8600 key support level again. The bearish bias will continue to be favored as long as the descending resistance -shown on the daily chart above -and 0.8500 key resistance are halting upside attempts. EUR/GBP_S&R" title="EUR/GBP_S&R" width="634" height="113">
- English (UK)
- English (India)
- English (Canada)
- English (Australia)
- English (South Africa)
- English (Philippines)
- English (Nigeria)
- Deutsch
- Español (España)
- Español (México)
- Français
- Italiano
- Nederlands
- Polski
- Português (Portugal)
- Português (Brasil)
- Русский
- Türkçe
- العربية
- Ελληνικά
- Svenska
- Suomi
- עברית
- 日本語
- 한국어
- 简体中文
- 繁體中文
- Bahasa Indonesia
- Bahasa Melayu
- ไทย
- Tiếng Việt
- हिंदी
Daily Technical Report: Major And Cross Currencies - May 17, 2013
Published 05/17/2013, 06:35 AM
Updated 07/09/2023, 06:31 AM
Daily Technical Report: Major And Cross Currencies - May 17, 2013
Latest comments
Loading next article…
Install Our App
Risk Disclosure: Trading in financial instruments and/or cryptocurrencies involves high risks including the risk of losing some, or all, of your investment amount, and may not be suitable for all investors. Prices of cryptocurrencies are extremely volatile and may be affected by external factors such as financial, regulatory or political events. Trading on margin increases the financial risks.
Before deciding to trade in financial instrument or cryptocurrencies you should be fully informed of the risks and costs associated with trading the financial markets, carefully consider your investment objectives, level of experience, and risk appetite, and seek professional advice where needed.
Fusion Media would like to remind you that the data contained in this website is not necessarily real-time nor accurate. The data and prices on the website are not necessarily provided by any market or exchange, but may be provided by market makers, and so prices may not be accurate and may differ from the actual price at any given market, meaning prices are indicative and not appropriate for trading purposes. Fusion Media and any provider of the data contained in this website will not accept liability for any loss or damage as a result of your trading, or your reliance on the information contained within this website.
It is prohibited to use, store, reproduce, display, modify, transmit or distribute the data contained in this website without the explicit prior written permission of Fusion Media and/or the data provider. All intellectual property rights are reserved by the providers and/or the exchange providing the data contained in this website.
Fusion Media may be compensated by the advertisers that appear on the website, based on your interaction with the advertisements or advertisers.
© 2007-2024 - Fusion Media Limited. All Rights Reserved.