
EUR/USD - European Session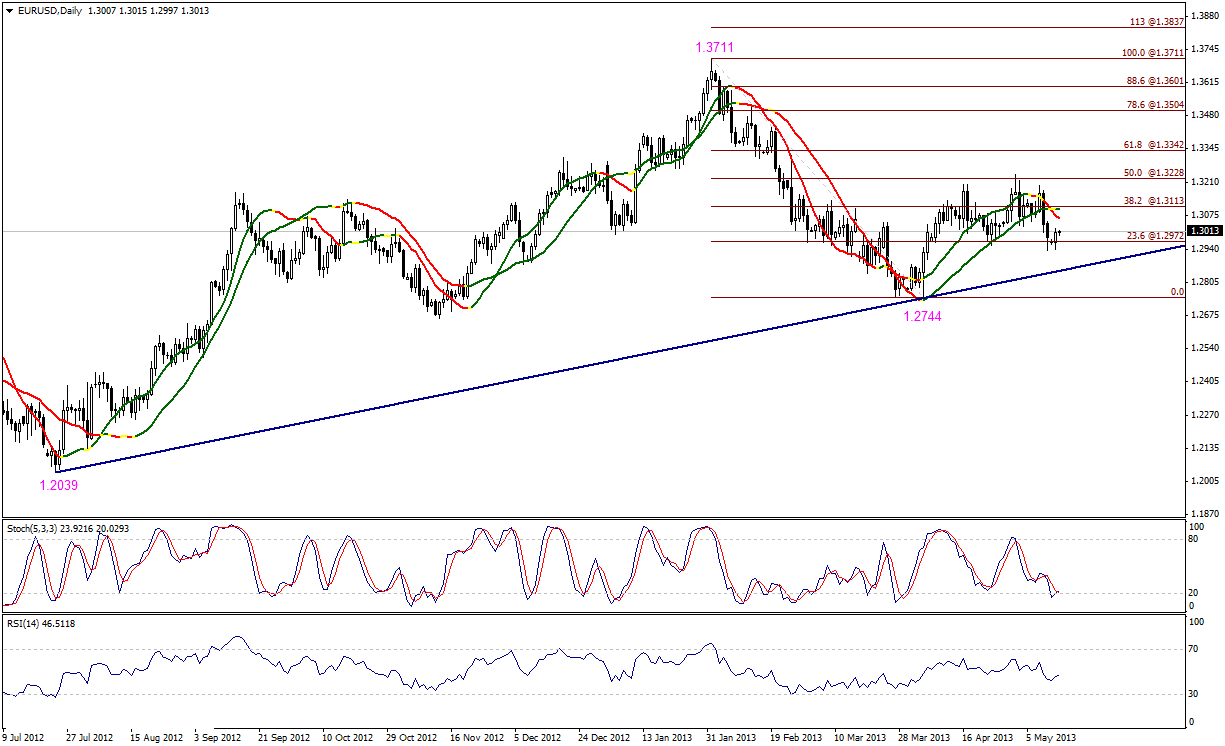 EUR/USD" title="EUR/USD" width="1225" height="746">
The pair moved to the upside after failing to stabilize below 1.2970 and Stochastic offered a positive crossover. The pair is stable below Linear Regression Indicators for now. The RSI is stable below 50, indicating that the upside move is considered a normal correction before extending the bearish move. Trading below 1.3115 forces us to hold on to our negative expectations, while stability below 1.3030 will trigger the downside move.
The trading range for today is among the key support at 1.2905, and key resistance at 1.3115.
The general trend over short term basis is to the downside, targeting 1.2560 as far as areas of 1.3270 remains intact.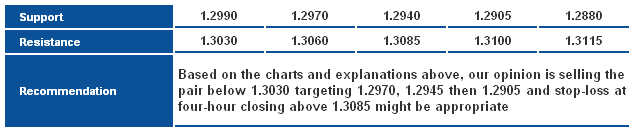 EUR/USD_S&R" title="EUR/USD_S&R" width="636" height="133">
GBP/USD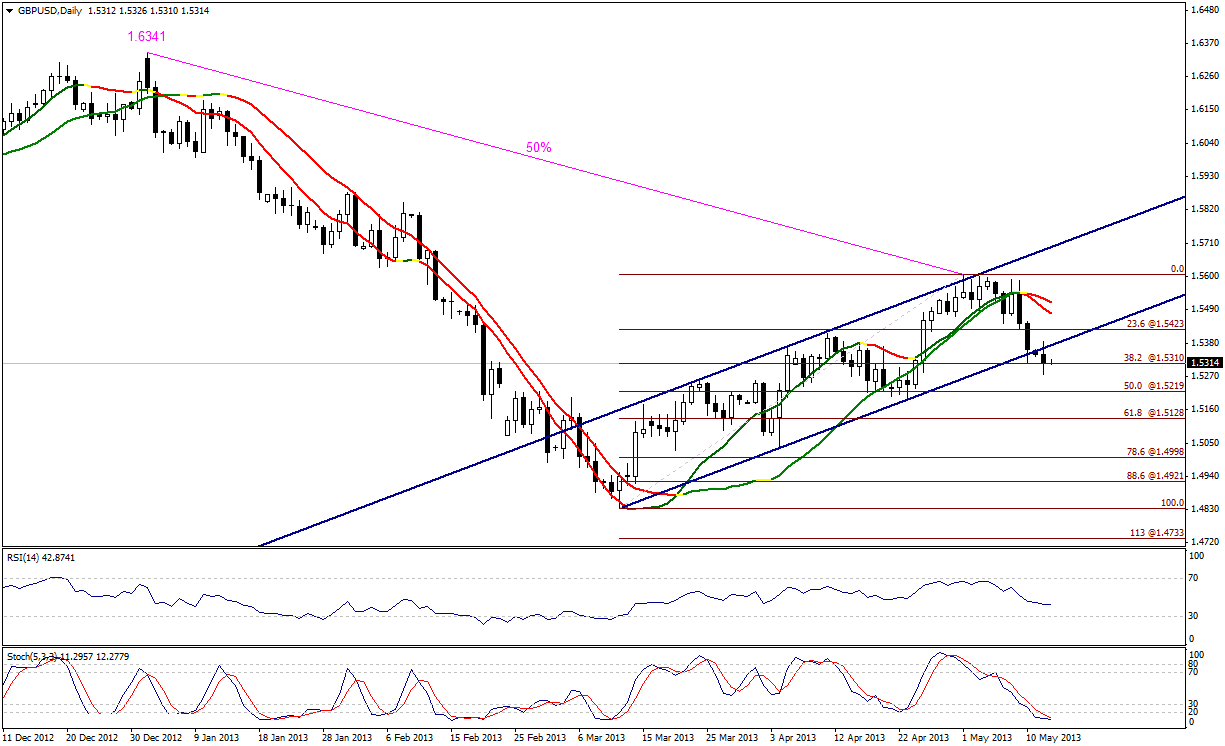 GBP/USD" title="GBP/USD" width="1225" height="746">
The GBP/USD pair dropped again yesterday in light of breaking key support of the minor ascending channel, as shown on graph. Stochastic offers intraday oversold signals, but trading below 1.5425 keeps negativity valid. Linear Regression Indicators support our expectations.
The trading range for this week is among key support at 1.5175, and key resistance at 1.5425.
The general trend over short term basis is to the downside as far as areas of 1.5770 remains intact, targeting 1.4355.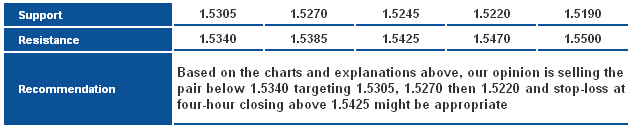 GBP/USD_S&R" title="GBP/USD_S&R" width="633" height="129">
USD/JPY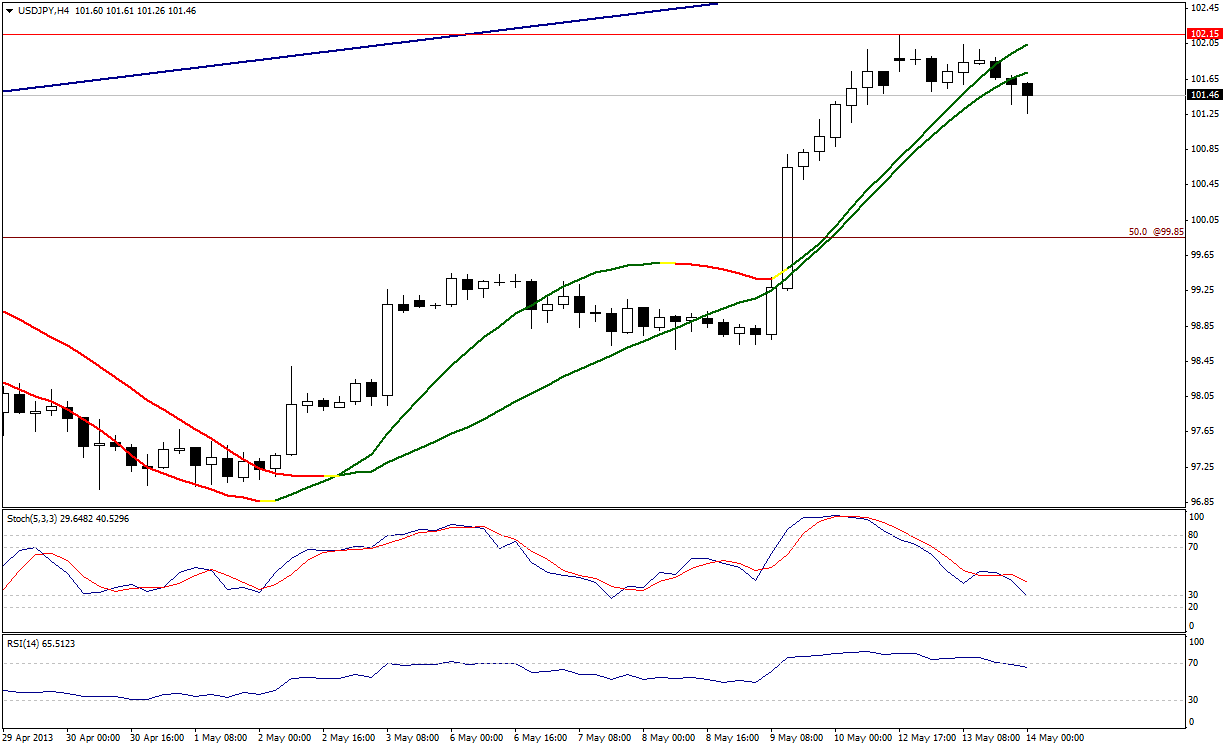 USD/JPY" title="USD/JPY" width="1225" height="746">
The USD/JPY pair is biased negatively over a four-hour basis despite overall upside trend as shown on graph, indicating possibility of a downside correction before extending general positivity. With stability below Linear Regression Indicators and bearish bias on momentum indicators, trading below 102.15 keeps the possibility of a downside move valid today.
The trading range for today is among key support at 100.35, and key resistance at 102.80.
The general trend over short term basis is to the upside as far as areas of 96.50 remain intact, targeting 105.60.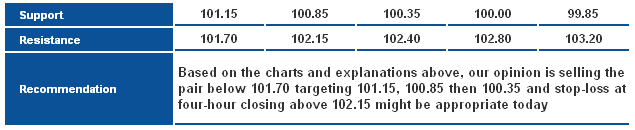 USD/JPY_S&R" title="USD/JPY_S&R" width="635" height="130">
USD/CHF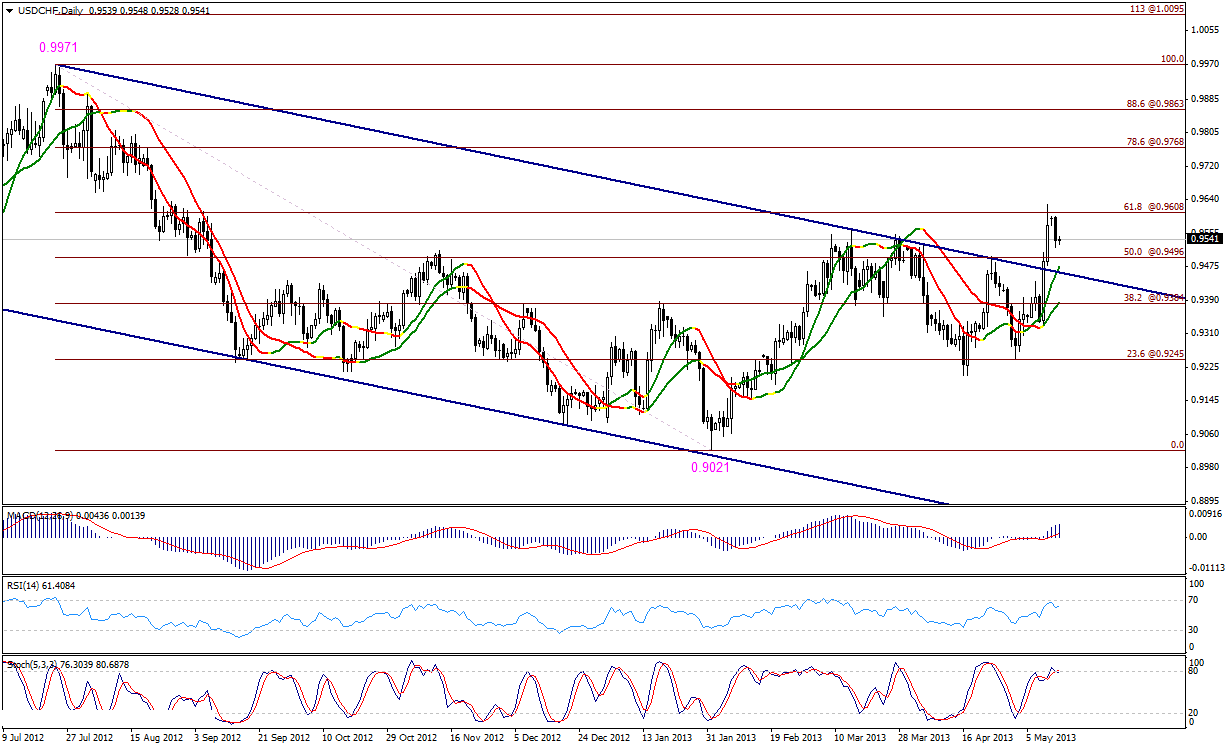 USD/CHF" title="USD/CHF" width="1225" height="746">
The USD/CHF pair's downside move yesterday remained limited above key resistance level of the descending channel, and above 50% correction at 0.9495. The possibility of positivity is still valid, and Linear Regression Indicators support our expectations. Indicators will be ignored as far as 0.9425 areas hold intraday overbought signals on momentum.
The trading range for today is among key support at 0.9425, and key resistance at 0.9720.
The general trend over short term basis is to the downside, stable at levels 0.9775 targeting 0.8860.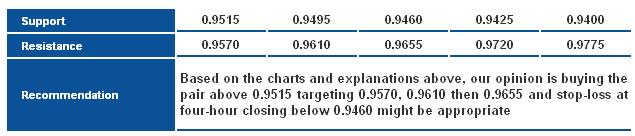 USD/CHF_S&R" title="USD/CHF_S&R" width="635" height="136">
USD/CAD USD/CAD" title="USD/CAD" width="736" height="527">
The USD/CAD pair failed yesterday to breach 1.0140 levels, representing the first target of the bearish harmonic Bat Pattern where earlier, the pair reached the second target. Despite failing to breach 1.0140 levels, the pair is stable above 50% correction of CD Leg of the pattern at 1.0075 levels and above Linear Regression Indicators. A new attempt to the upside is possible in order to breach 1.0140 levels to end the bearish harmonic pattern’s effect and resume the upside move, confirming the formation of the ascending channel shown on graph.
The trading range for today is between the key support at 1.0015, and the key resistance at 1.0215.
The general trend over short term basis is to the upside, with steady daily closing above levels 0.9800 targeting 1.0485.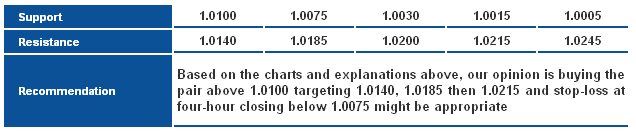 USD/CAD_S&R" title="USD/CAD_S&R" width="636" height="133">
AUD/USD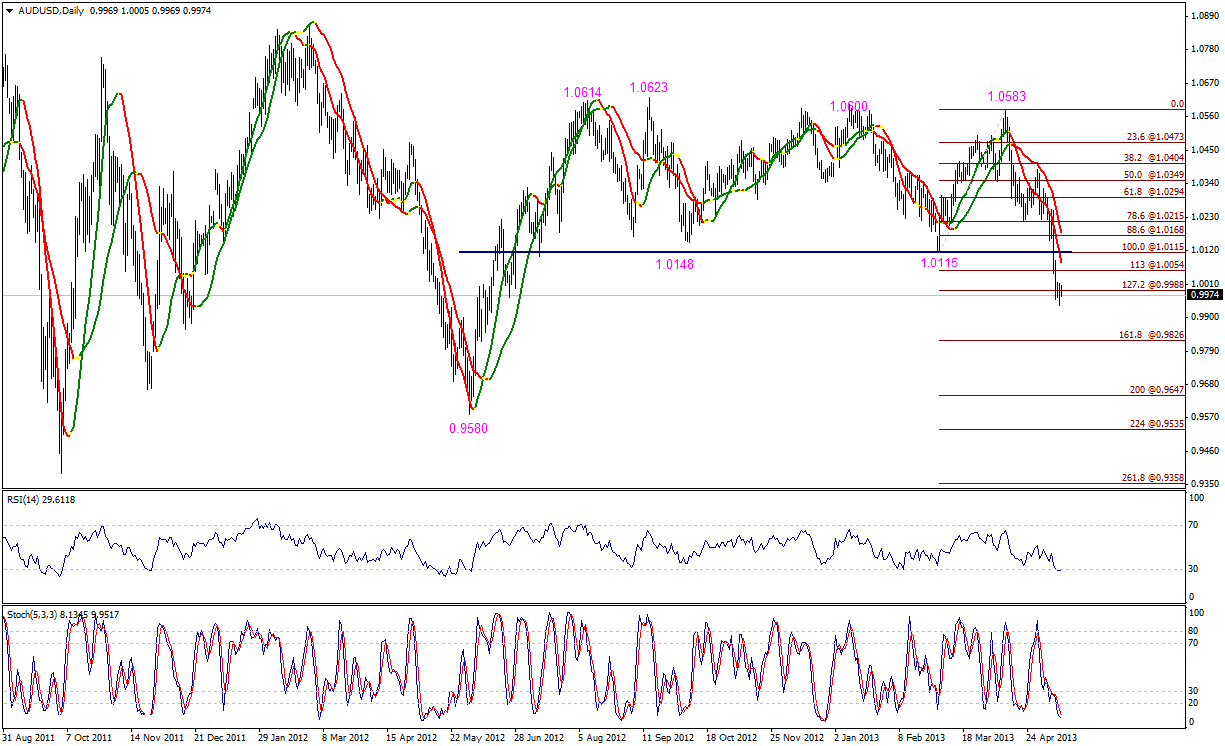 AUD/USD" title="AUD/USD" width="1225" height="746">
The AUD/USD is unable to complete the upside correction, despite oversold signals reflected by momentum indicators; stability below 127.2% Fibonacci at 0.9990 will boost chances of the extension of the downtrend all the way to Fibonacci 161.8% at 0.9825. Trading below 1.0115 will maintain overall negative expectations. Stability below 1.0055 better supports negativity.
Trading range expected today is between the key support at 0.9825 ,and the key resistance 1.0115.
Short-term trend is donwside targeting 0.9400 if 1.0710 remains intact.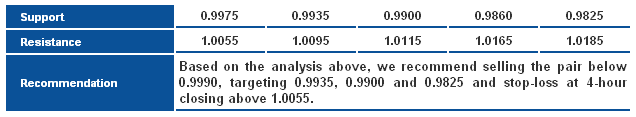 AUD/USD_S&R" title="AUD/USD_S&R" width="636" height="117">
NZD/USD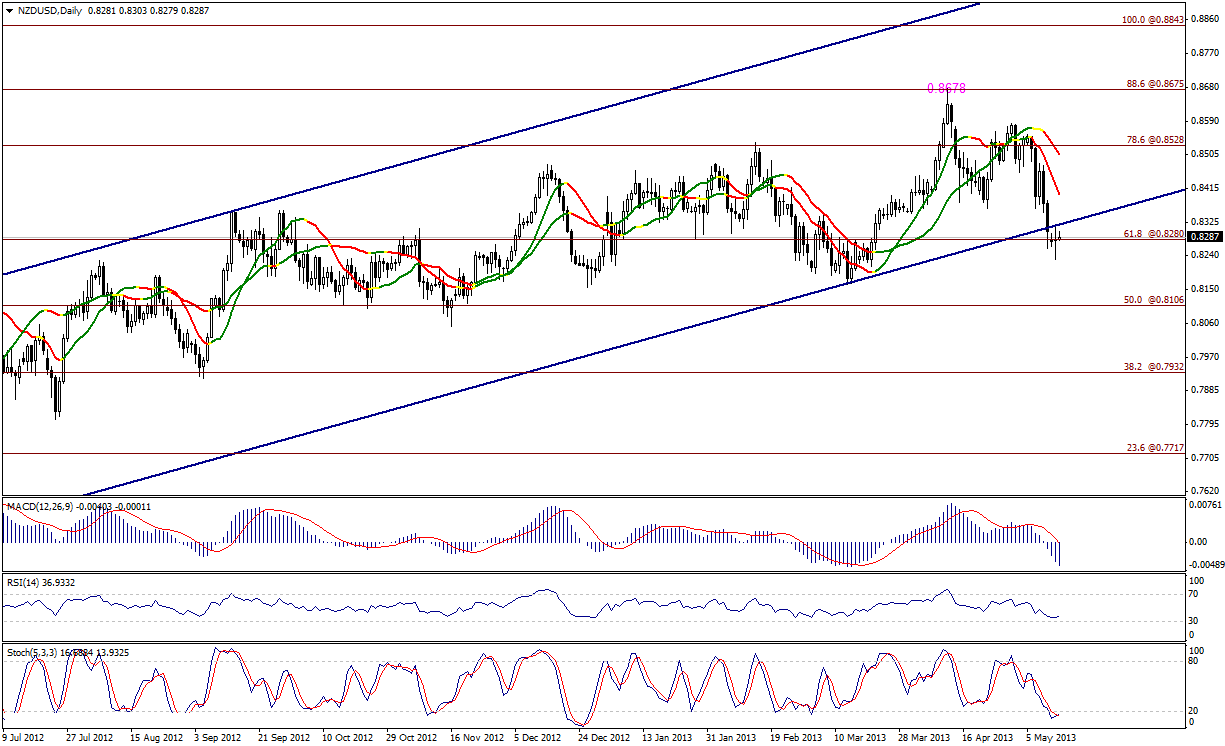 NZD/USD" title="NZD/USD" width="1225" height="746">
The NZD/USD's negative trading continues below the bullish channel's support, keeping expectations of a potential downtrend valid. Stochastic is trading in oversold areas, yet trading below 0.8355 will be considered negative for today.
Trading range expected today is between the key support at 0.8135, and the key resistance 0.8385.
Short-term trend is upside, targeting 0.8845 if 0.8130 remains intact.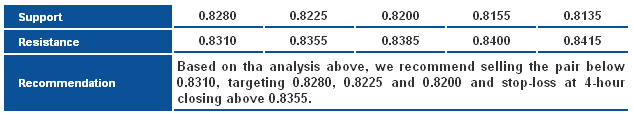 NZD/USD_S&R" title="NZD/USD_S&R" width="633" height="119">
GBP/JPY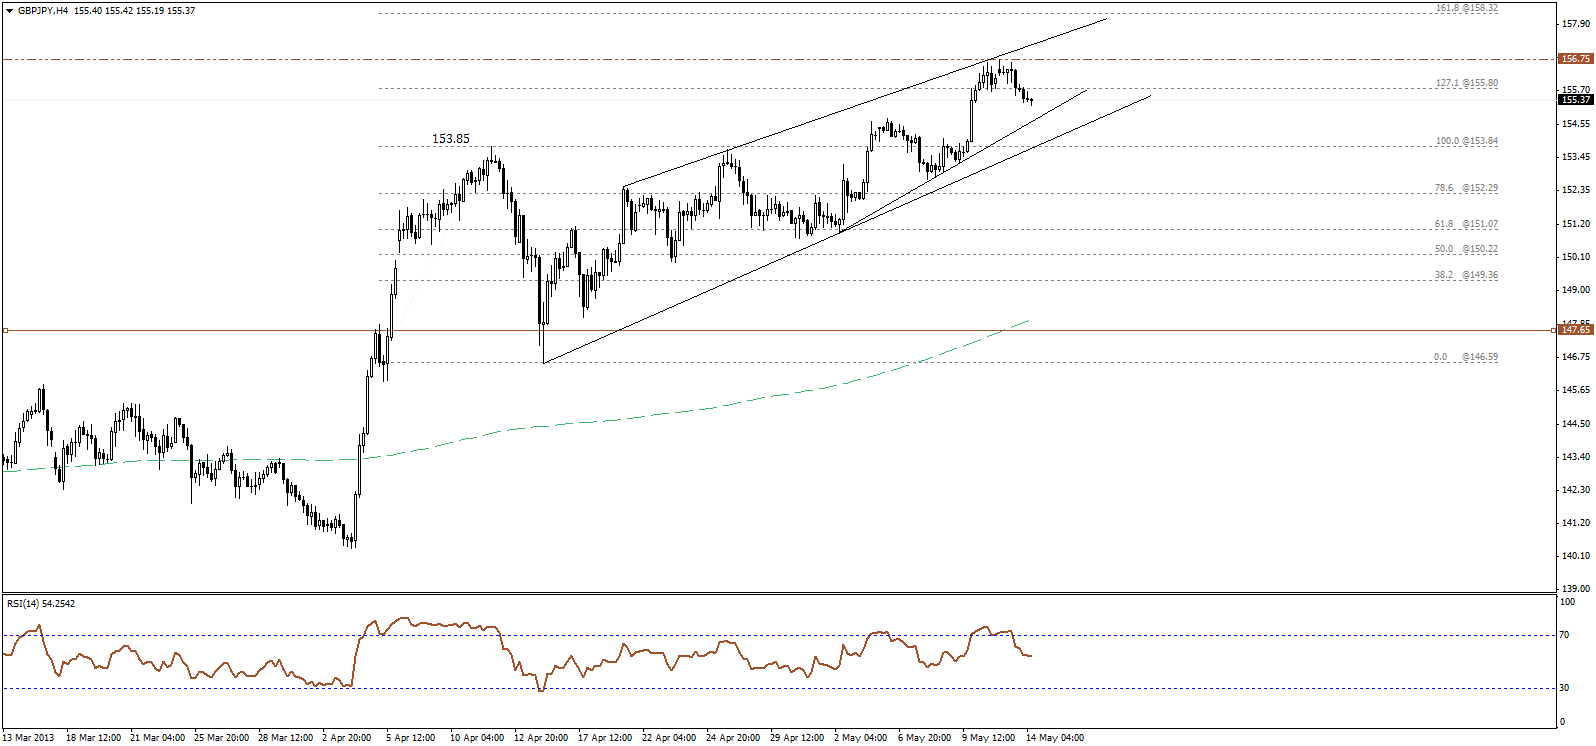 GBP/JPY" title="GBP/JPY" width="1596" height="746">
The GBP/JPY pair was initially rejected from 156.75 resistance level, and is currently approaching the previous high at 154.75 which may form a support for the currently bullish wave, it is also near the minor ascending trend line shown on the chart above. We expect a bullish rebound over intraday basis.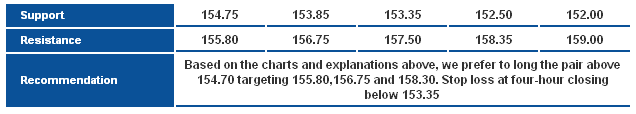 GBP/JPY_S&R" title="GBP/JPY_S&R" width="636" height="114">
EUR/JPY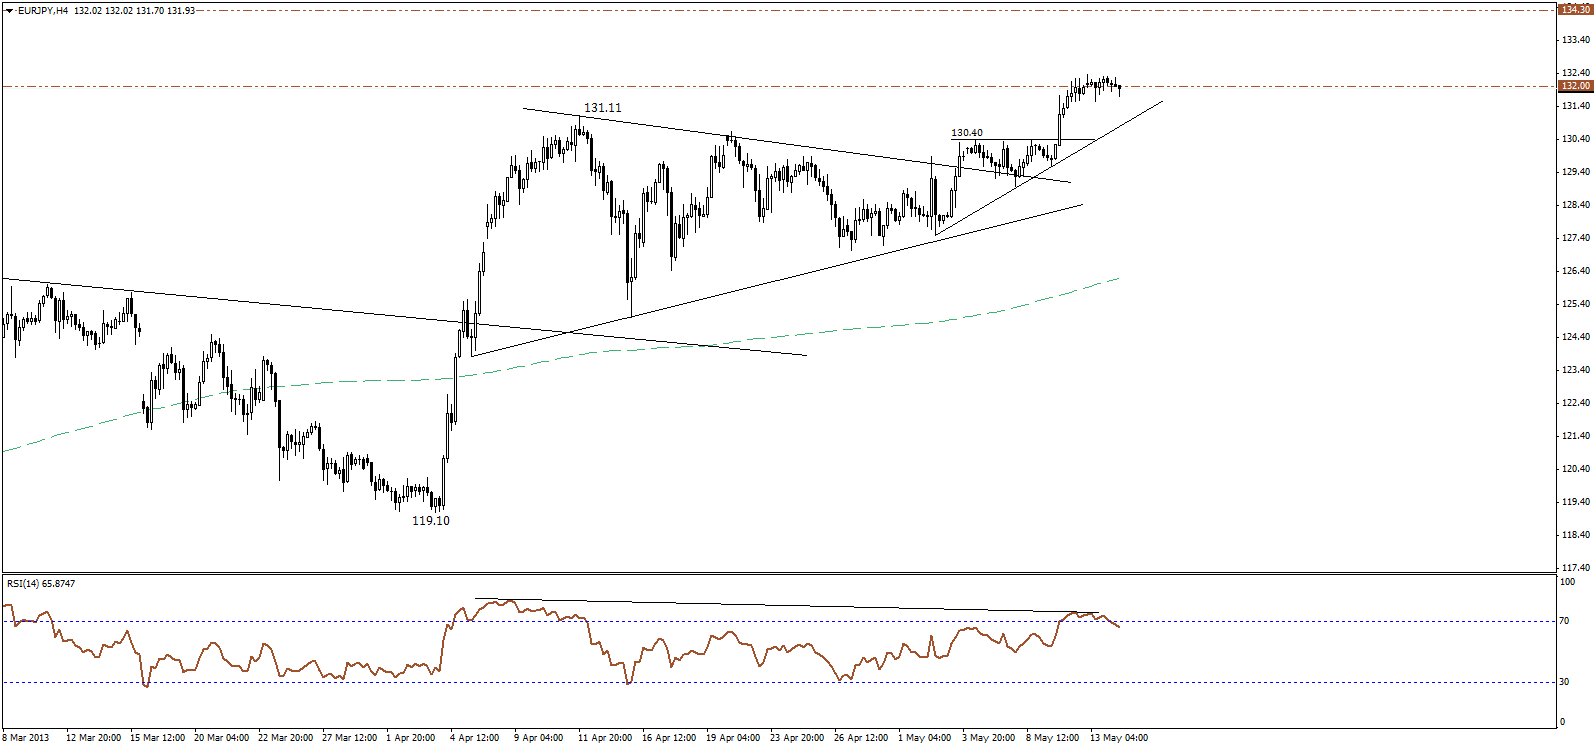 EUR/JPY" title="EUR/JPY" width="1596" height="746">
The EURJPY pair continues to fluctuate narrowly around 132.00 key resistance, while we spotted a bearish divergence on RSI over the four-hour and daily time intervals. We prefer to remain on the sidelines today as well, as we may see a downside pullback. A clear break above 132.00 may negate the divergence and force us to reconsider the bullish scenario.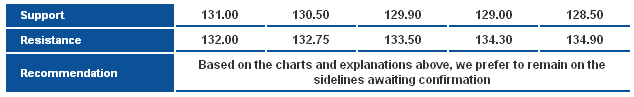 EUR/JPY_S&R" title="EUR/JPY_S&R" width="634" height="97">
EUR/GBP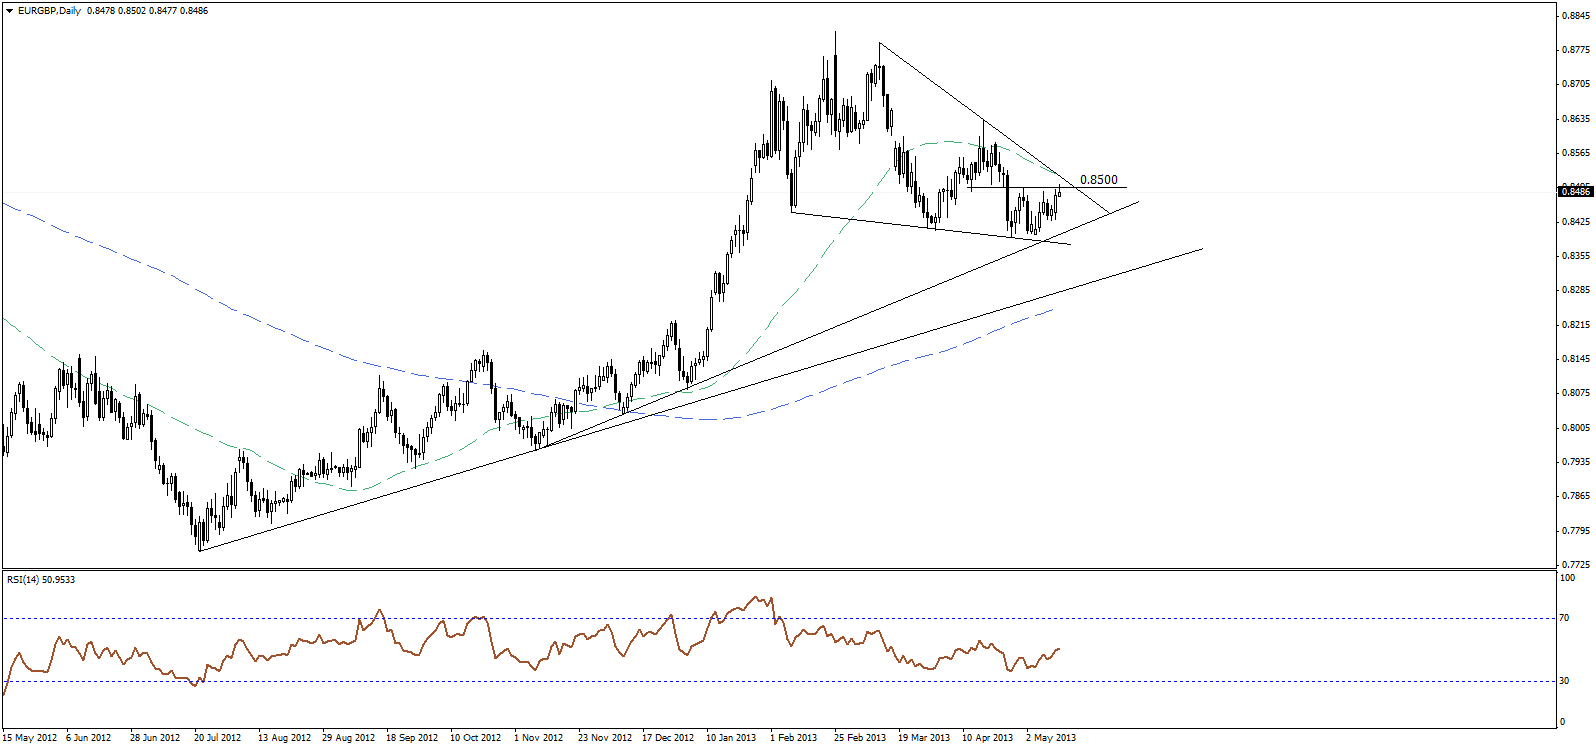 EUR/GBP" title="EUR/GBP" width="1596" height="746">
The EUR/GBP pair pushed higher towards 0.8500 horizontal resistance, just below the main descending resistance for the bullish reversal falling wedge pattern. One more step is needed to confirm further upside, through breaking 0.8500 area and the resistance of the wedge.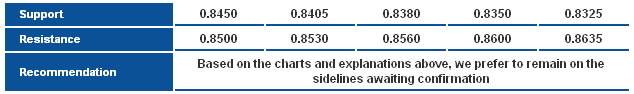 EUR/GBP_S&R" title="EUR/GBP_S&R" width="634" height="94">
- English (UK)
- English (India)
- English (Canada)
- English (Australia)
- English (South Africa)
- English (Philippines)
- English (Nigeria)
- Deutsch
- Español (España)
- Español (México)
- Français
- Italiano
- Nederlands
- Polski
- Português (Portugal)
- Português (Brasil)
- Русский
- Türkçe
- العربية
- Ελληνικά
- Svenska
- Suomi
- עברית
- 日本語
- 한국어
- 简体中文
- 繁體中文
- Bahasa Indonesia
- Bahasa Melayu
- ไทย
- Tiếng Việt
- हिंदी
Daily Technical Report: Major And Cross Currencies - May 14, 2013
Published 05/14/2013, 05:20 AM
Updated 07/09/2023, 06:31 AM
Daily Technical Report: Major And Cross Currencies - May 14, 2013
Latest comments
Loading next article…
Install Our App
Risk Disclosure: Trading in financial instruments and/or cryptocurrencies involves high risks including the risk of losing some, or all, of your investment amount, and may not be suitable for all investors. Prices of cryptocurrencies are extremely volatile and may be affected by external factors such as financial, regulatory or political events. Trading on margin increases the financial risks.
Before deciding to trade in financial instrument or cryptocurrencies you should be fully informed of the risks and costs associated with trading the financial markets, carefully consider your investment objectives, level of experience, and risk appetite, and seek professional advice where needed.
Fusion Media would like to remind you that the data contained in this website is not necessarily real-time nor accurate. The data and prices on the website are not necessarily provided by any market or exchange, but may be provided by market makers, and so prices may not be accurate and may differ from the actual price at any given market, meaning prices are indicative and not appropriate for trading purposes. Fusion Media and any provider of the data contained in this website will not accept liability for any loss or damage as a result of your trading, or your reliance on the information contained within this website.
It is prohibited to use, store, reproduce, display, modify, transmit or distribute the data contained in this website without the explicit prior written permission of Fusion Media and/or the data provider. All intellectual property rights are reserved by the providers and/or the exchange providing the data contained in this website.
Fusion Media may be compensated by the advertisers that appear on the website, based on your interaction with the advertisements or advertisers.
© 2007-2024 - Fusion Media Limited. All Rights Reserved.