
EUR/USD - European Session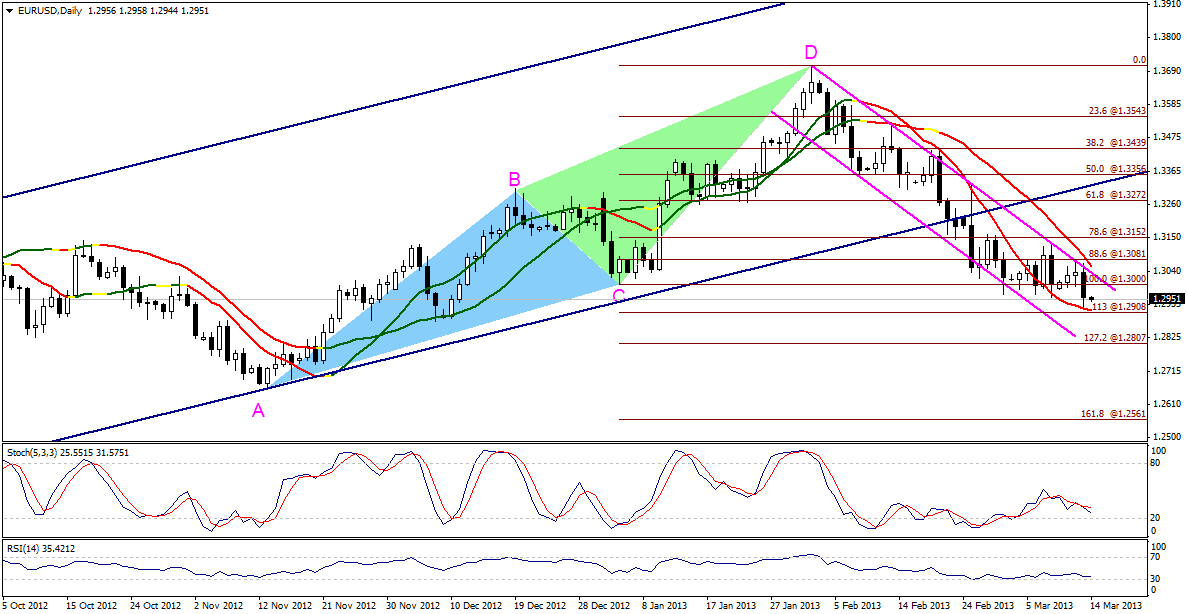 EUR/USD" title="EUR/USD" width="1187" height="614">
The EUR/USD pair managed to stable below 1.3000 levels which is negative and could push the pair to the downside towards the extended targets of the AB=CD bearish harmonic Pattern. The descending channel shown on the graph also supports extending negativity to test 1.2905 levels and perhaps towards 1.2805 levels. Stability below 1.3080 levels is an initial catalyst to maintain these expectations.
The trading range for today is among the key support at 1.2805 and key resistance at 1.3080.
The general trend over short term basis is to the upside targeting 1.4375 as far as areas of 1.2990 remains intact.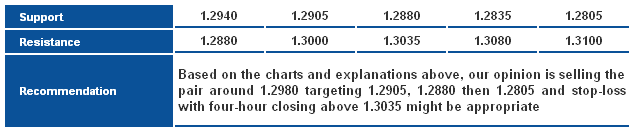 EUR/USD_S&R" title="EUR/USD_S&R" width="632" height="130">
GBP/USD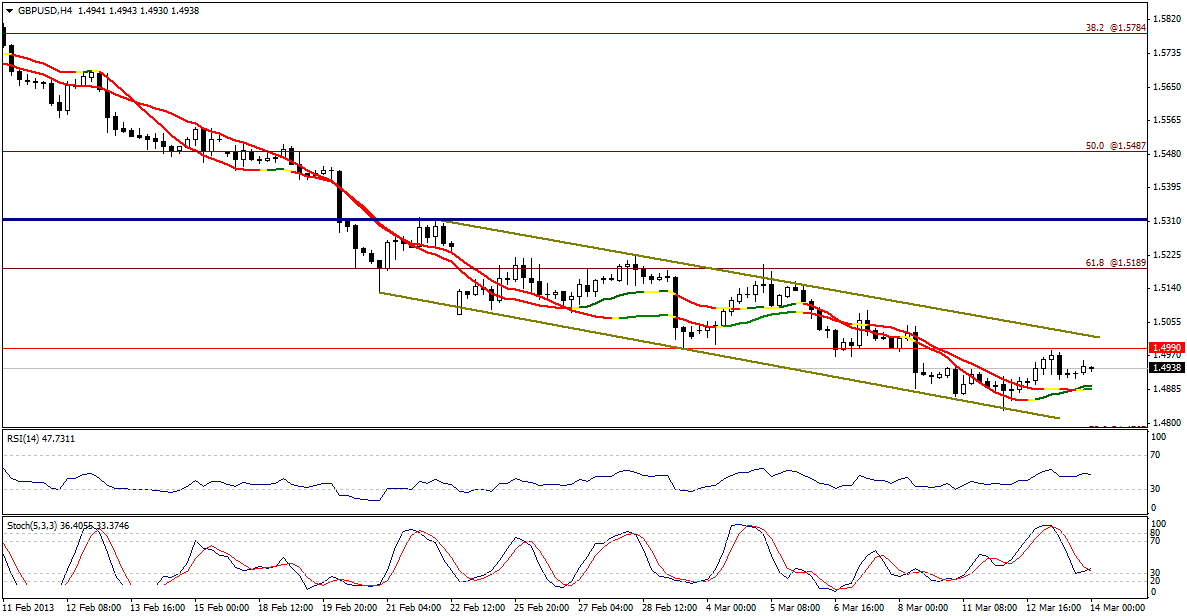 GBP/USD" title="GBP/USD" width="1187" height="616">
The GBP/USD pair traded in volatility yesterday, but remained limited below 1.4990 levels and below key resistance level of the descending channel as shown on the graph. The previously mentioned forces us to hold on to our negative expectations; especially that RSI is stable below line 50. Linear Regression Indicators are showing some positivity that requires breaking 1.4880 levels to further support the bearish move.
The trading range for today is among key support at 1.4765 and key resistance at 1.5080.
The general trend over short term basis is to the downside targeting 1.4225 as far as areas of 1.6875 remains intact.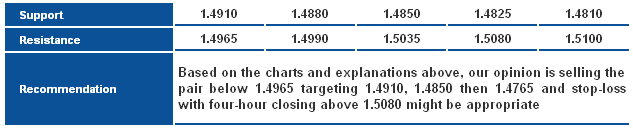 GBP/USD_S&R" title="GBP/USD_S&R" width="633" height="130">
USD/JPY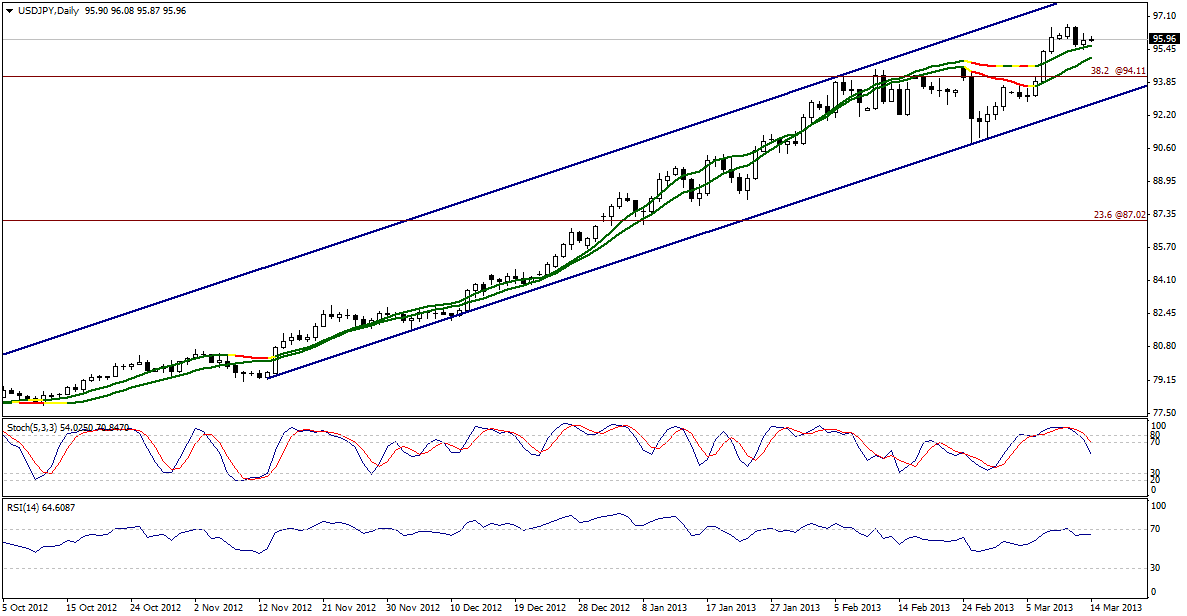 USD/JPY" title="USD/JPY" width="1187" height="616">
The USD/JPY pair has stabled above Linear Regression Indicators, despite moving to the downside earlier as shown on the daily graph, therefore it might stay stable above 95.50 levels. Stability above the referred to level is positive and might extend the bullish move during today’s session.
The trading range for today is among key support at 94.10 and key resistance at 97.10.
The general trend over short term basis is to the upside targeting 100.00 as far as areas of 84.00 remain intact.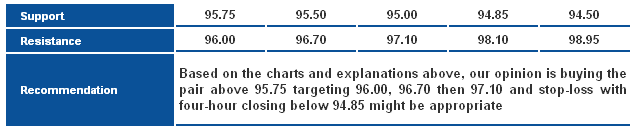 USD/JPY_S&R" title="USD/JPY_S&R" width="636" height="131">
USD/CHF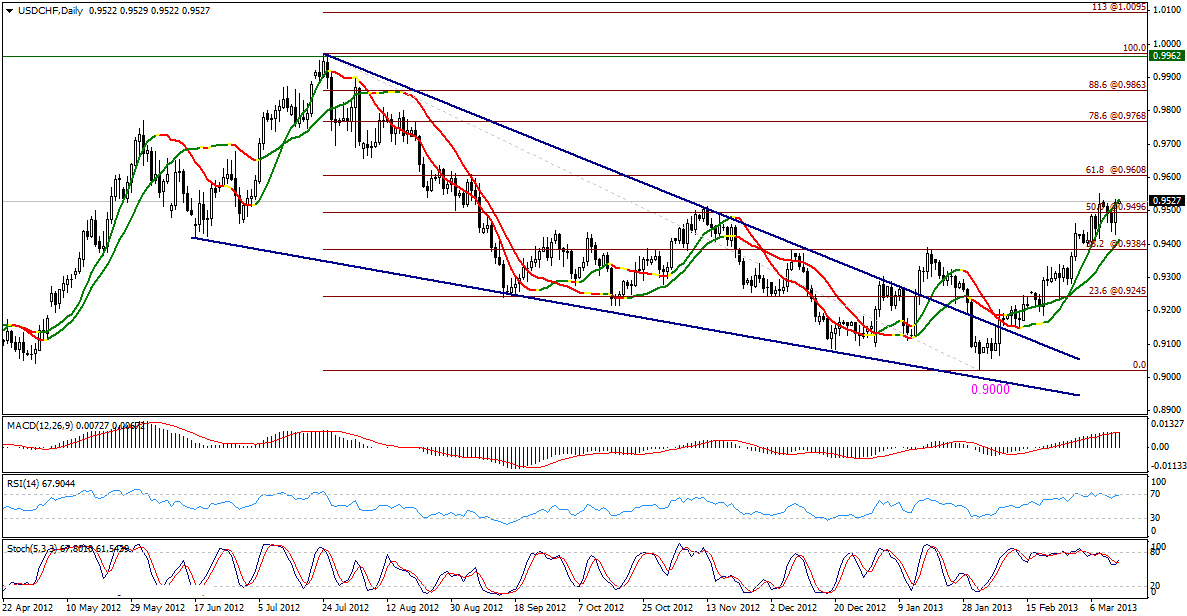 USD/CHF" title="USD/CHF" width="1187" height="616">
The USD/CHF pair rose sharply yesterday, and is trading again above 0.9495 levels, by breaching this level represented in 50% correction bullishness might extend testing 61.8% correction at 0.9610 levels shown on the graph. Stability above 0.9375 levels is positive, but for today’s intraday trading we will count on stabilizing above 0.9465 levels.
The trading range for today is among key support at 0.9425 and key resistance at 0.9720.
The general trend over short term basis is to the downside stable at levels 0.9775 targeting 0.8860.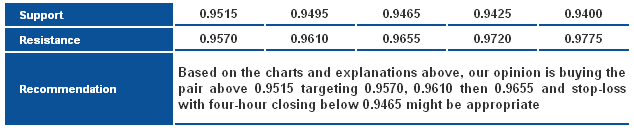 USD/CHF_S&R" title="USD/CHF_S&R" width="634" height="128">
USD/CAD USD/CAD" title="USD/CAD" width="630" height="376">
The USD/CAD pair is trading in a narrow range but is still limited from the upside below Potential Reversal Zone of the bearish harmonic Bat Pattern. Stability below 1.0355 levels keeps the possibility of a downside move of the harmonic pattern valid, especially that the pair is stable below Linear Regression Indicators.
The trading range for today is between the key support at 1.0140 and the key resistance at 1.0445.
The general trend over short term basis is to the upside with steady daily closing above levels 0.9800 targeting 1.0485.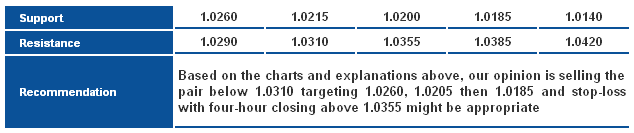 USD/CAD_S&R" title="USD/CAD_S&R" width="634" height="133">
AUD/USD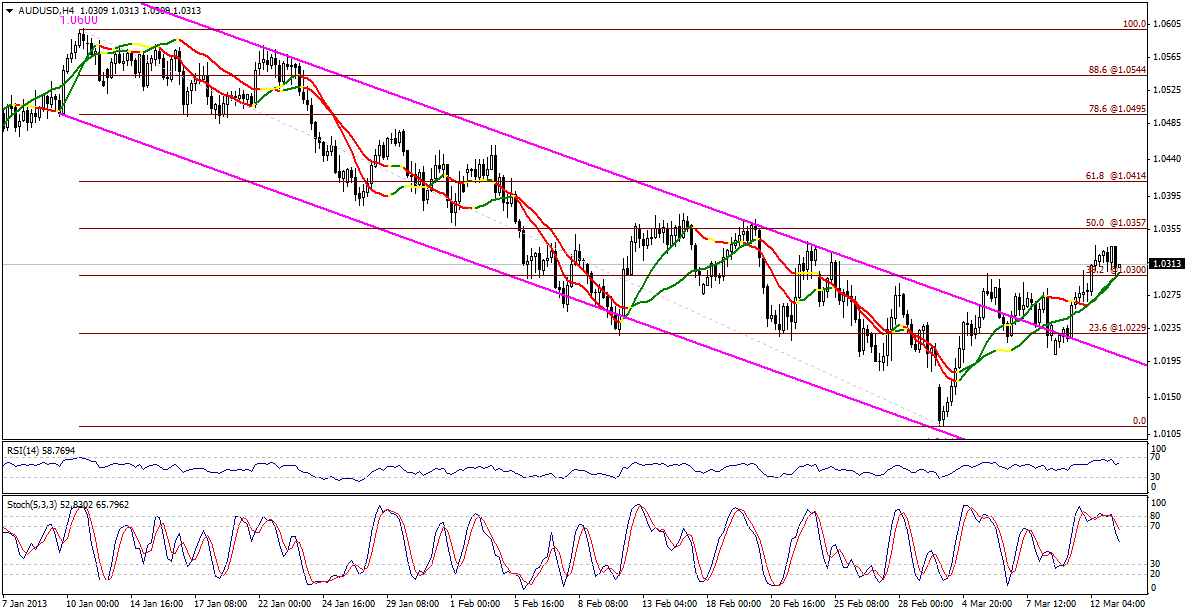 AUD/USD" title="AUD/USD" width="1187" height="612">
The AUD/USD pair dropped and touched levels around 38.2% correction at 1.0300 levels and remained stable above it. Hence, the possibility of bullishness remains valid during today’s session and Linear Regression Indicators support our outlook.
The trading range for today is among key support at 1.0200 and key resistance at 1.0415.
The general trend over short term basis is to the downside with steady daily closing below levels 1.0710 targeting 0.9400.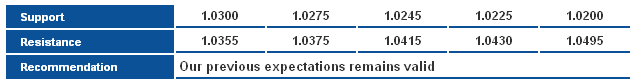 AUD/USD_S&R" title="AUD/USD_S&R" width="635" height="83">
NZD/USD NZD/USD" title="NZD/USD" width="1187" height="612">
The NZD/USD pair failed to breach key resistance levels of the downside move, but at the same time we find it stable above Linear Regression Indicators that are positive now. Before breaching the resistance level, we cannot confirm the extension of the upside move; meanwhile before trading again below Linear Regression Indicators it is not safe to bet on the bearish move. Therefore, we prefer to remain neutral for the rest of the day.
The trading range for today might be among key support at 0.8160 and key resistance at 0.8355.
The general short-term trend is expected to the upside with daily closing above 0.8130 targeting 0.8845.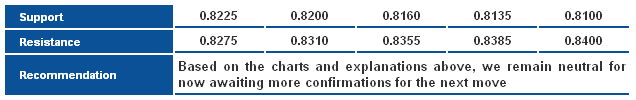 NZD/USD_S&R" title="NZD/USD_S&R" width="636" height="100">
GBP/JPY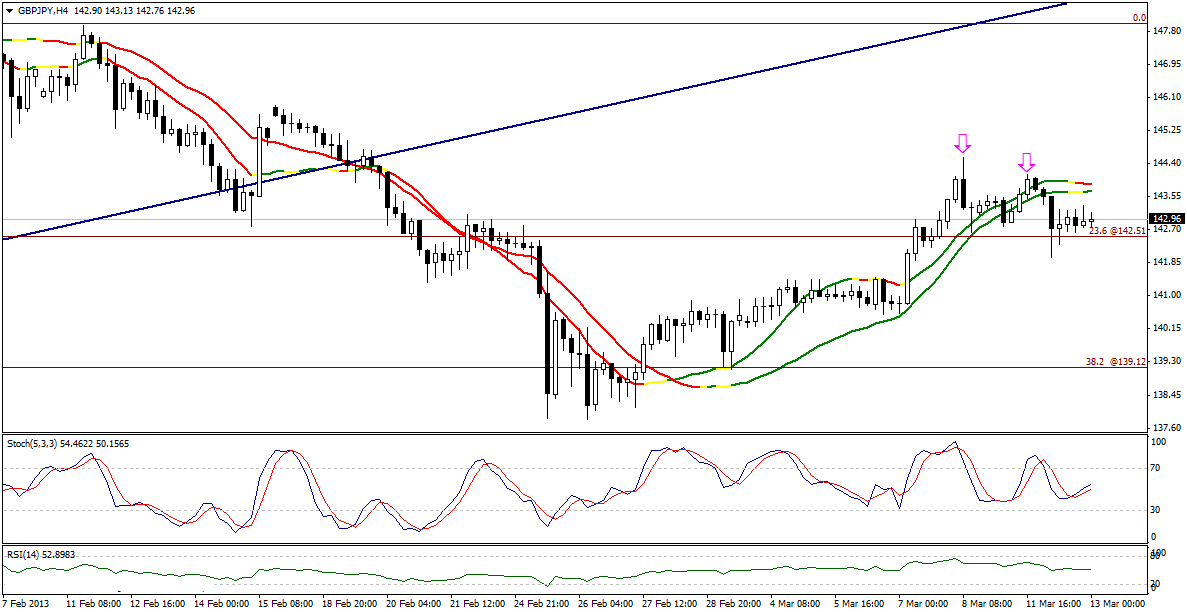 GBP/JPY" title="GBP/JPY" width="1187" height="612">
The GBP/JPY settled above 142.50 after forming two consecutive tops earlier, the first of which was formed slightly higher than the second. It rendered us less able to bet on a bullish trend, especially as Linear Regression Indicators hinder the pair from the upside creating resistances. Therefore, we prefer to stay aside today.
– The trading range expected today is between the key support at 141.10 and the key resistance at 145.80
– The short-term trend is downside targeting 133.60 if 147.80 remains intact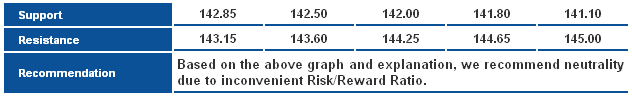 GBP/JPY_S&R" title="GBP/JPY_S&R" width="632" height="98">
EUR/JPY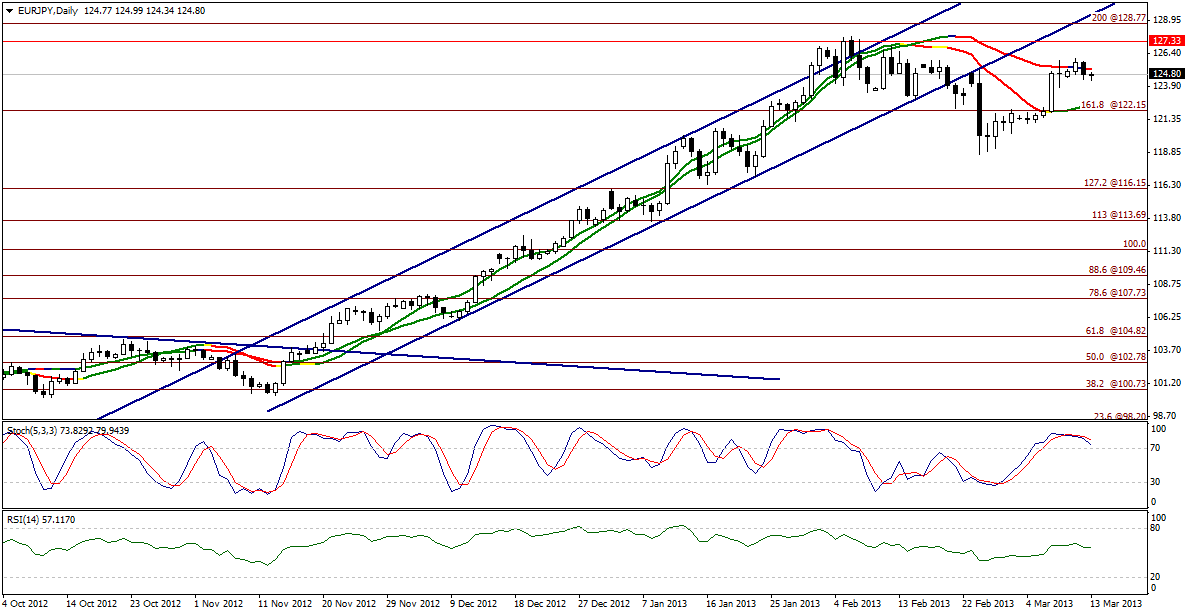 EUR/JPY" title="EUR/JPY" width="1187" height="612">
The EUR/JPY failed to consolidate above LRI 55, the thing that weakened the bullish momentum, sending the pair dropping again in response to overbought indications signaled by Stochastic. At the same time, the pair's stable position above 122.15 renders betting on a downtrend rather risky therefore, we prefer to maintain neutral for today.
– The trading range expected today is between the key support at 122.15 and the key resistance at 127.35
– The short-term trend is upside targeting 128.75 if 109.45 remains intact at weekly closing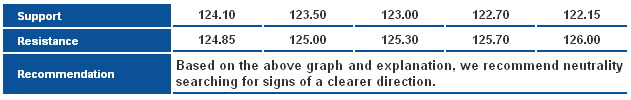 EUR/JPY_S&R" title="EUR/JPY_S&R" width="631" height="100">
NZD/USD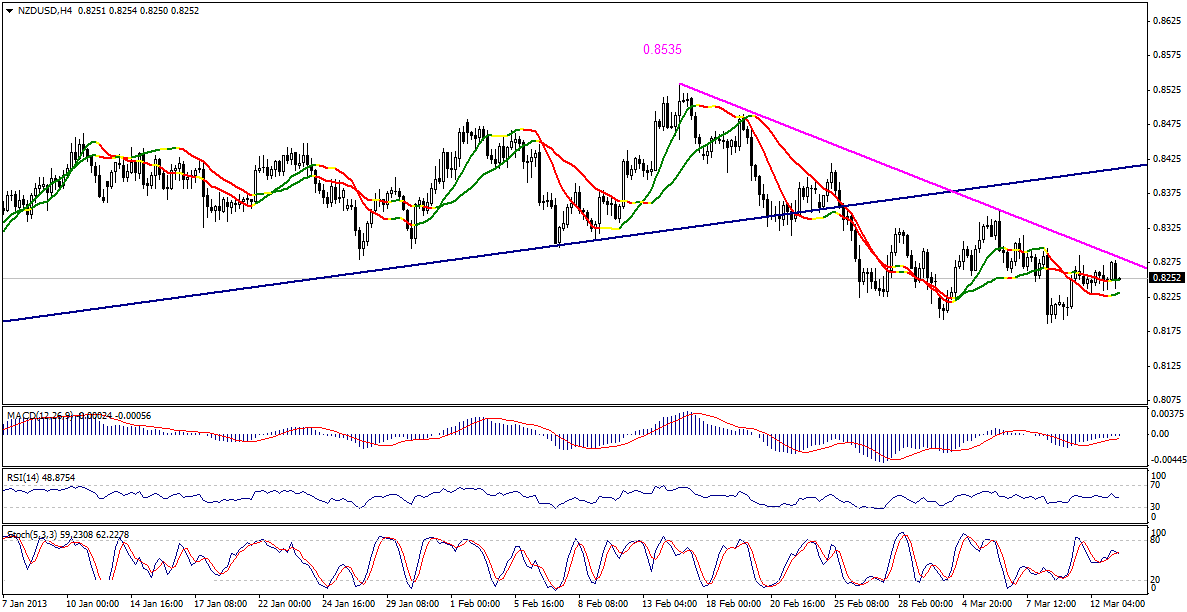 NZD/USD" title="NZD/USD" width="1187" height="612">
The NZD/USD dropped again, trading below the bullish key support after touching level neighboring the proposed objective 0.8800. That bearishness sent the pair below LRIs, while RSI adopts a downside bias. As a result, its likely that we'll see more bearishness, depending on the pair's capability to break below 0.8690.
– The trading range expected today is between the key support at 0.8575 and the key resistance at 0.8800
– The short-term trend is upside targeting 1.0370 if 0.7785 remains intact NZD/USD_S&R" title="NZD/USD_S&R" width="636" height="100">
- English (UK)
- English (India)
- English (Canada)
- English (Australia)
- English (South Africa)
- English (Philippines)
- English (Nigeria)
- Deutsch
- Español (España)
- Español (México)
- Français
- Italiano
- Nederlands
- Português (Portugal)
- Polski
- Português (Brasil)
- Русский
- Türkçe
- العربية
- Ελληνικά
- Svenska
- Suomi
- עברית
- 日本語
- 한국어
- 简体中文
- 繁體中文
- Bahasa Indonesia
- Bahasa Melayu
- ไทย
- Tiếng Việt
- हिंदी
Daily Technical Report: Major And Cross Currencies - March 14, 2013
Published 03/14/2013, 03:01 AM
Updated 07/09/2023, 06:31 AM
Daily Technical Report: Major And Cross Currencies - March 14, 2013
Latest comments
Loading next article…
Install Our App
Risk Disclosure: Trading in financial instruments and/or cryptocurrencies involves high risks including the risk of losing some, or all, of your investment amount, and may not be suitable for all investors. Prices of cryptocurrencies are extremely volatile and may be affected by external factors such as financial, regulatory or political events. Trading on margin increases the financial risks.
Before deciding to trade in financial instrument or cryptocurrencies you should be fully informed of the risks and costs associated with trading the financial markets, carefully consider your investment objectives, level of experience, and risk appetite, and seek professional advice where needed.
Fusion Media would like to remind you that the data contained in this website is not necessarily real-time nor accurate. The data and prices on the website are not necessarily provided by any market or exchange, but may be provided by market makers, and so prices may not be accurate and may differ from the actual price at any given market, meaning prices are indicative and not appropriate for trading purposes. Fusion Media and any provider of the data contained in this website will not accept liability for any loss or damage as a result of your trading, or your reliance on the information contained within this website.
It is prohibited to use, store, reproduce, display, modify, transmit or distribute the data contained in this website without the explicit prior written permission of Fusion Media and/or the data provider. All intellectual property rights are reserved by the providers and/or the exchange providing the data contained in this website.
Fusion Media may be compensated by the advertisers that appear on the website, based on your interaction with the advertisements or advertisers.
© 2007-2025 - Fusion Media Limited. All Rights Reserved.