
EUR/USD - U.S. Session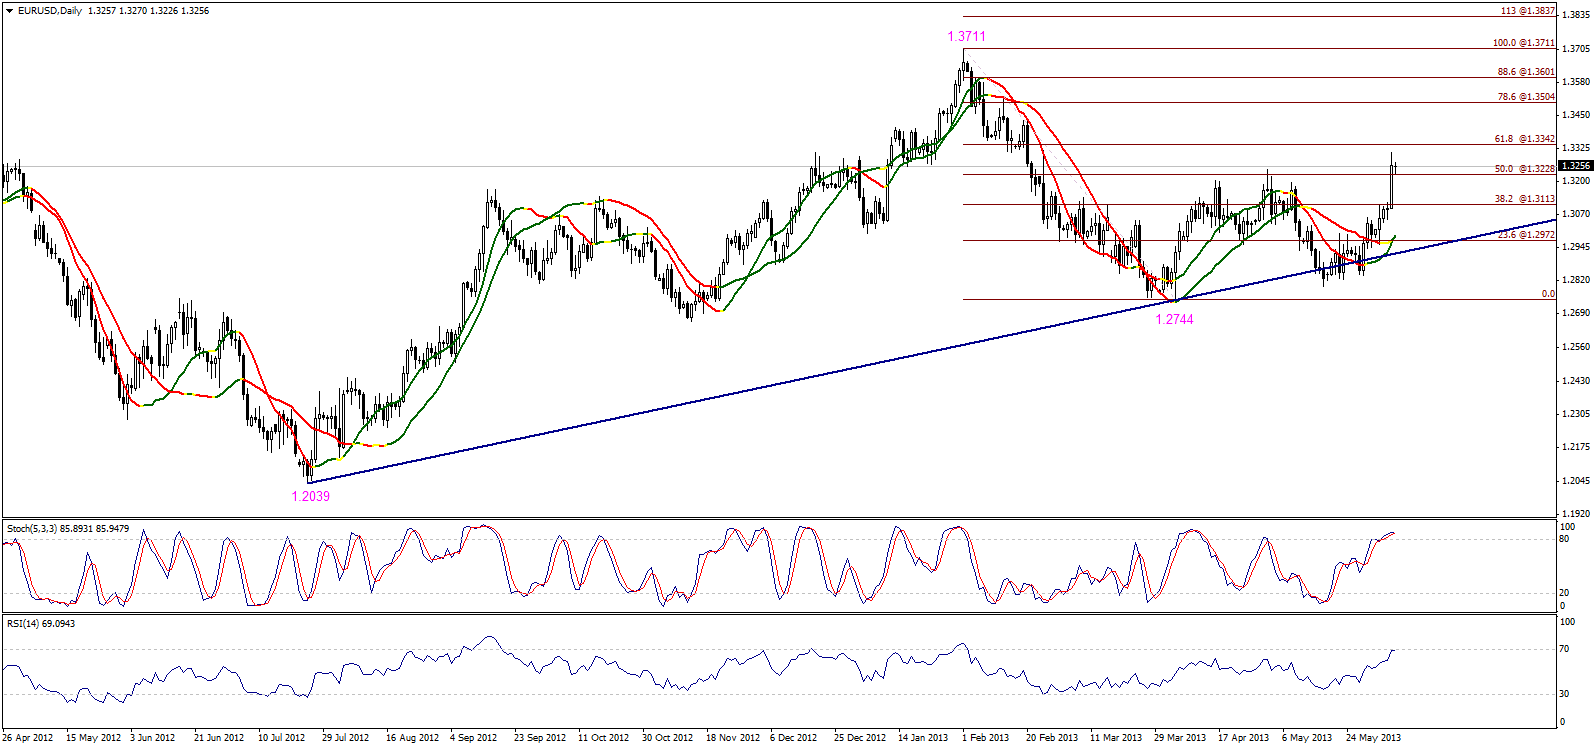 EUR/USD" title="EUR/USD" width="1596" height="746">
The pair touched 50% correction residing at 1.3225 then rebounded to the upside, where 1.3225 could have triggered a new push to the upside. Trading above 1.3225 might have breached 61.8% correction at 1.3345 levels, to move towards the first preferred target of the upside move at 1.3505.
Trading range was among the key support at 1.3110, and key resistance at 1.3505.
The general trend over short term basis was to the downside, targeting 1.2560 as far as areas of 1.3270 remained intact.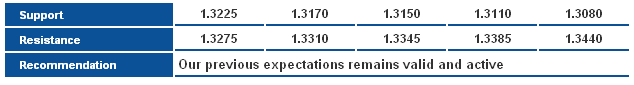 EUR/USD_S&R" title="EUR/USD_S&R" width="634" height="85">
GBP/USD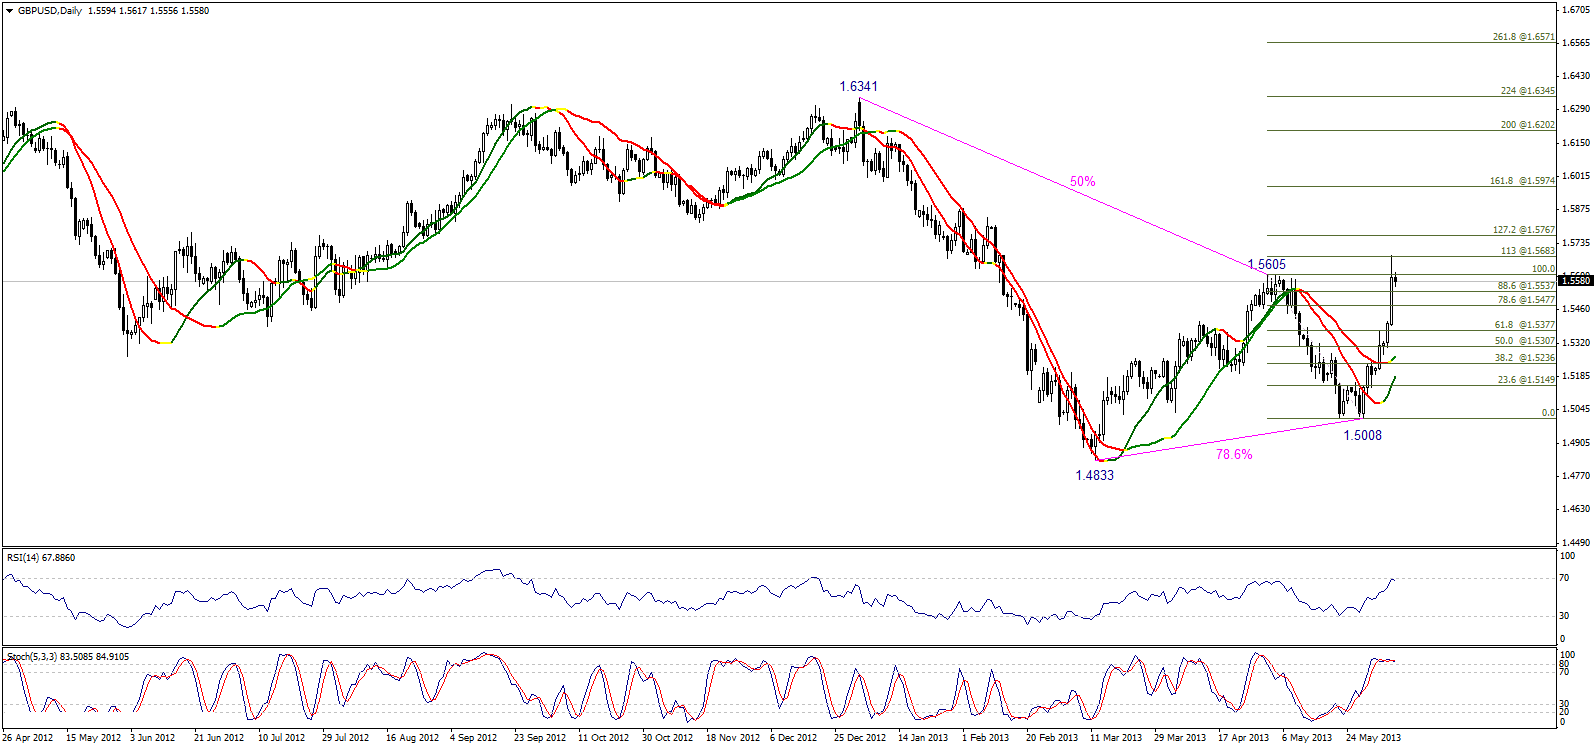 GBP/USD" title="GBP/USD" width="1596" height="746">
The pair failed to breach and stabilize above 1.5606 so far, but we see it stabilizing above 1.5535.
The trading range was among key support at 1.5375, and key resistance at 1.5770.
The general trend over short term basis was to the downside, as far as areas of 1.5770 remained intact, targeting 1.4355.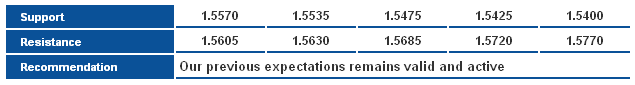 GBP/USD_S&R" title="GBP/USD_S&R" width="635" height="85">
USD/JPY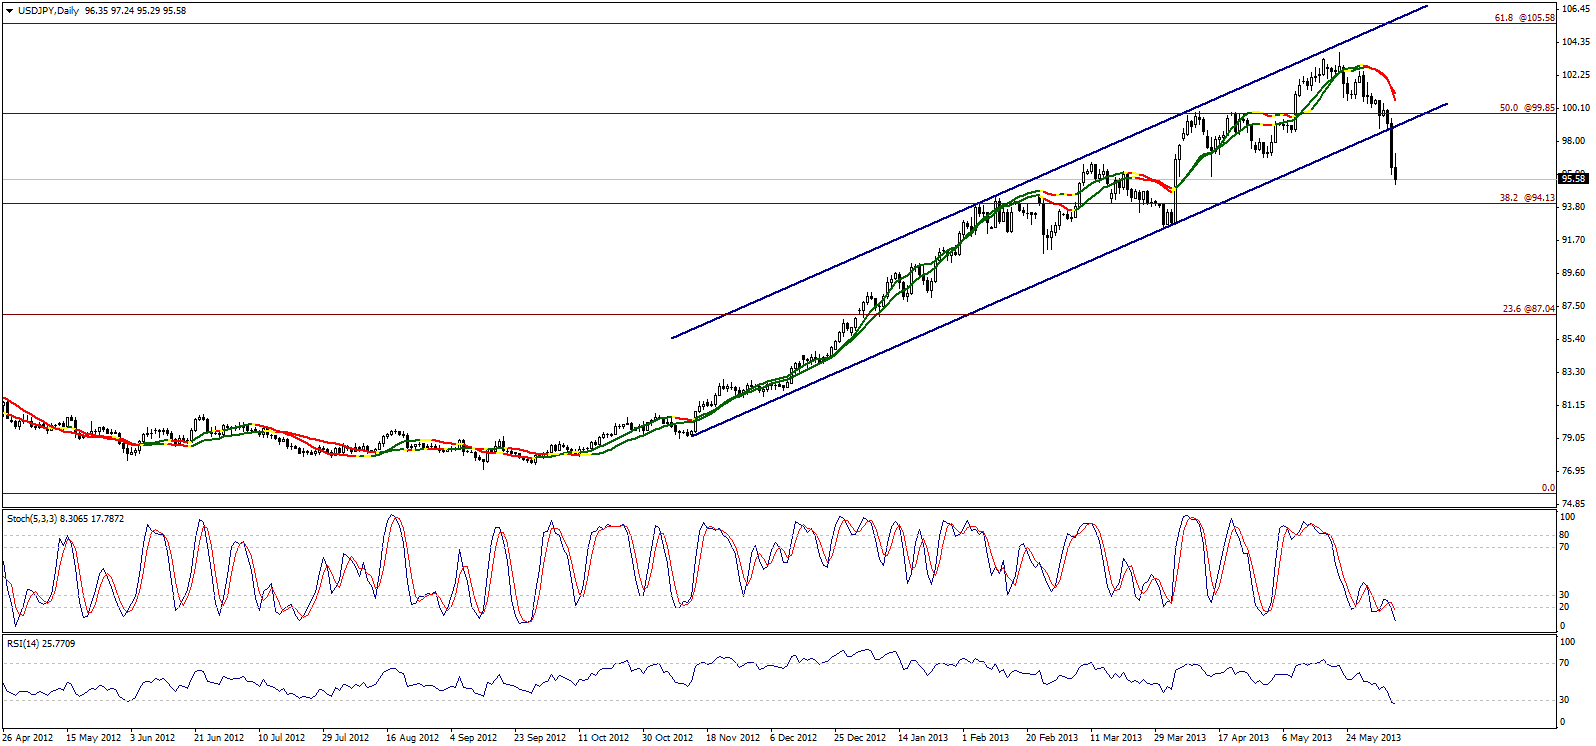 USD/JPY" title="USD/JPY" width="1596" height="746">
The pair dropped again, which is considered normal and an extension to the bearish correction that proved breaking key support levels of the ascending channel.
The trading range was among key support at 94.85 and key resistance at 97.85.
The general trend over short term basis is to the upside, as far as areas of 84.00 remained intact targeting 100.00.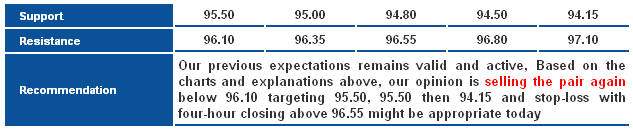 USD/JPY_S&R" title="USD/JPY_S&R" width="633" height="131">
USD/CHF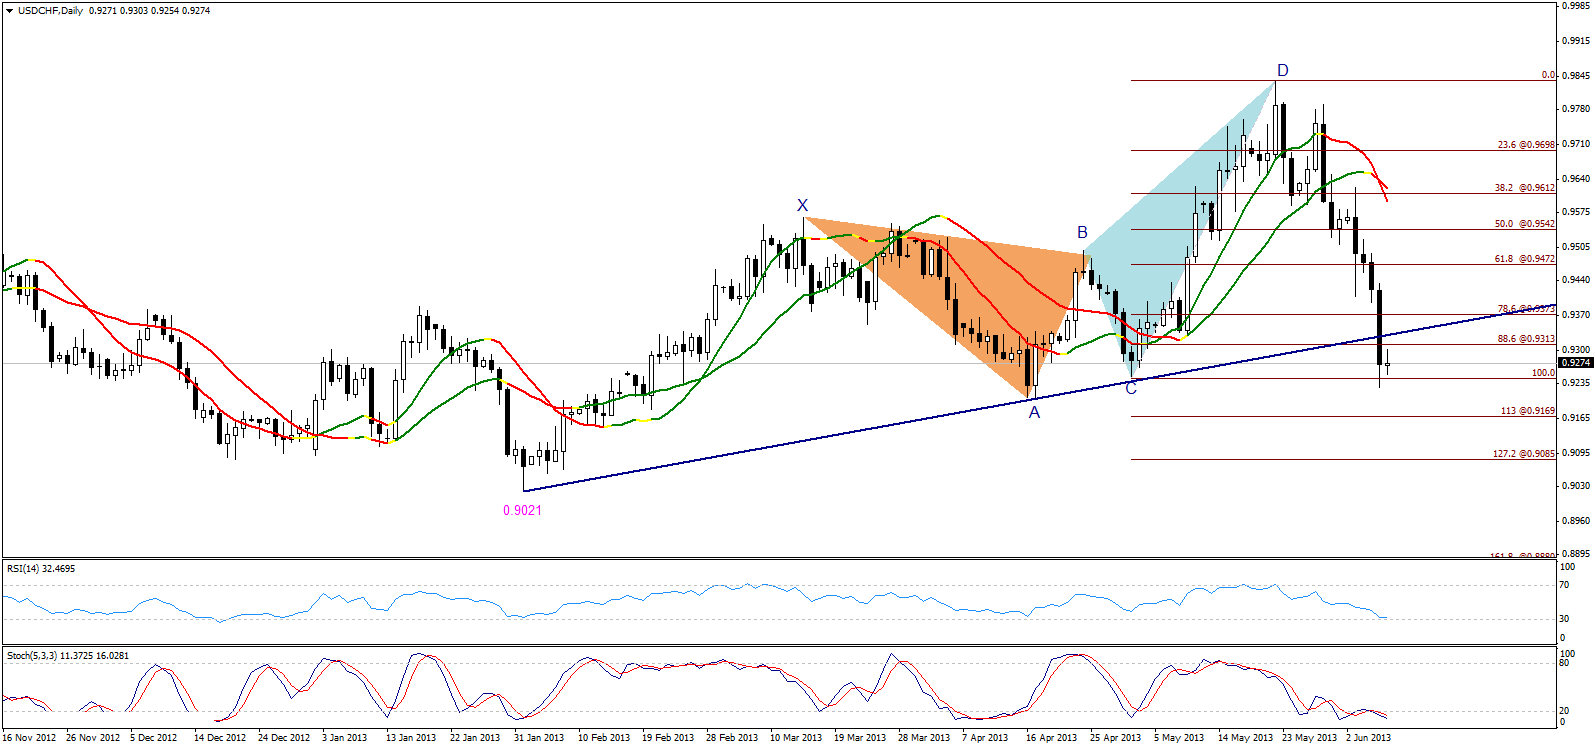 USD/CHF" title="USD/CHF" width="1596" height="746">
The pair’s trading was still limited below 88.6% correction of CD Leg of the bearish harmonic Butterfly Pattern and below the harmonic support shown on graph. The possibility of a downside move was still valid, and trading below 0.9375 maintains these expectations.
The trading range was among key support at 0.9085 and key resistance at 0.9375.
The general trend over short term basis is to the downside, stable at levels 0.9775 targeting 0.8860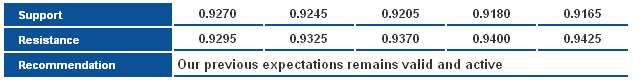 USD/CHF_S&R" title="USD/CHF_S&R" width="633" height="80">
USD/CAD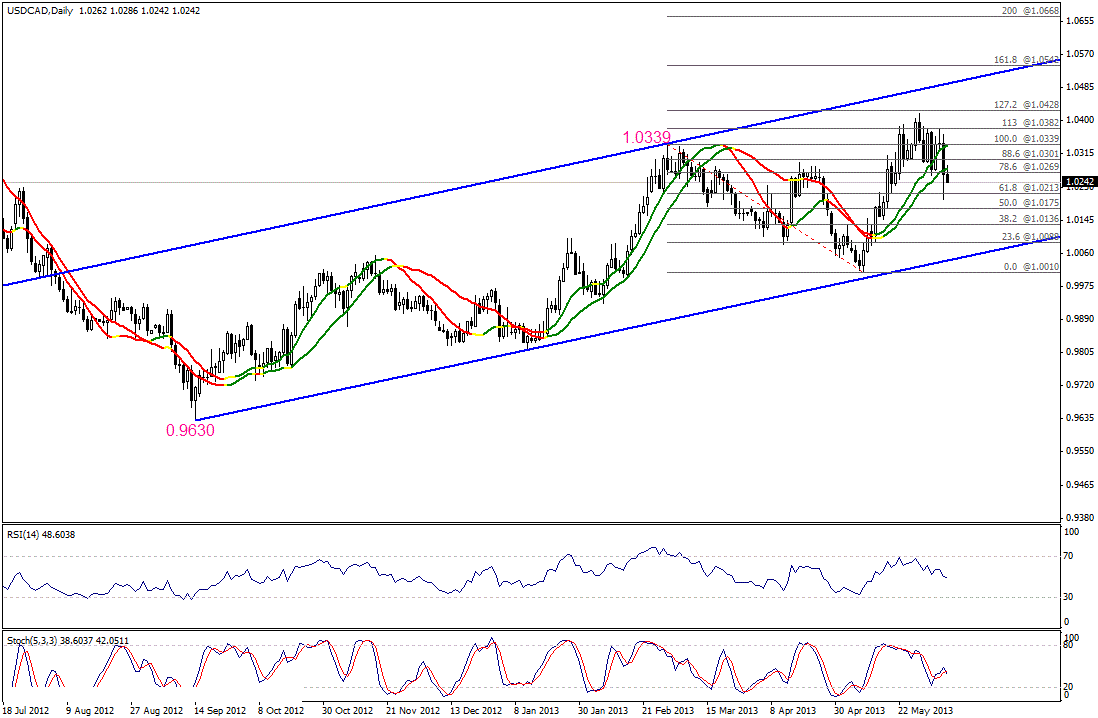 USD/CAD" title="USD/CAD" width="624" height="468">
The pair dropped after touching around 1.0270 levels again where most of Thursday’s losses were recovered. Due to the stability below 1.0270 and Linear Regression indicators shown on graph, the possibility of extending bearishness was valid Friday.
The trading range was between the key support at 1.0140 and the key resistance at 1.0385.
The general trend over short term basis is to the upside, with steady daily closing above levels 0.9800 targeting 1.0485. USD/CAD_S&R" title="USD/CAD_S&R" width="633" height="84">
AUD/USD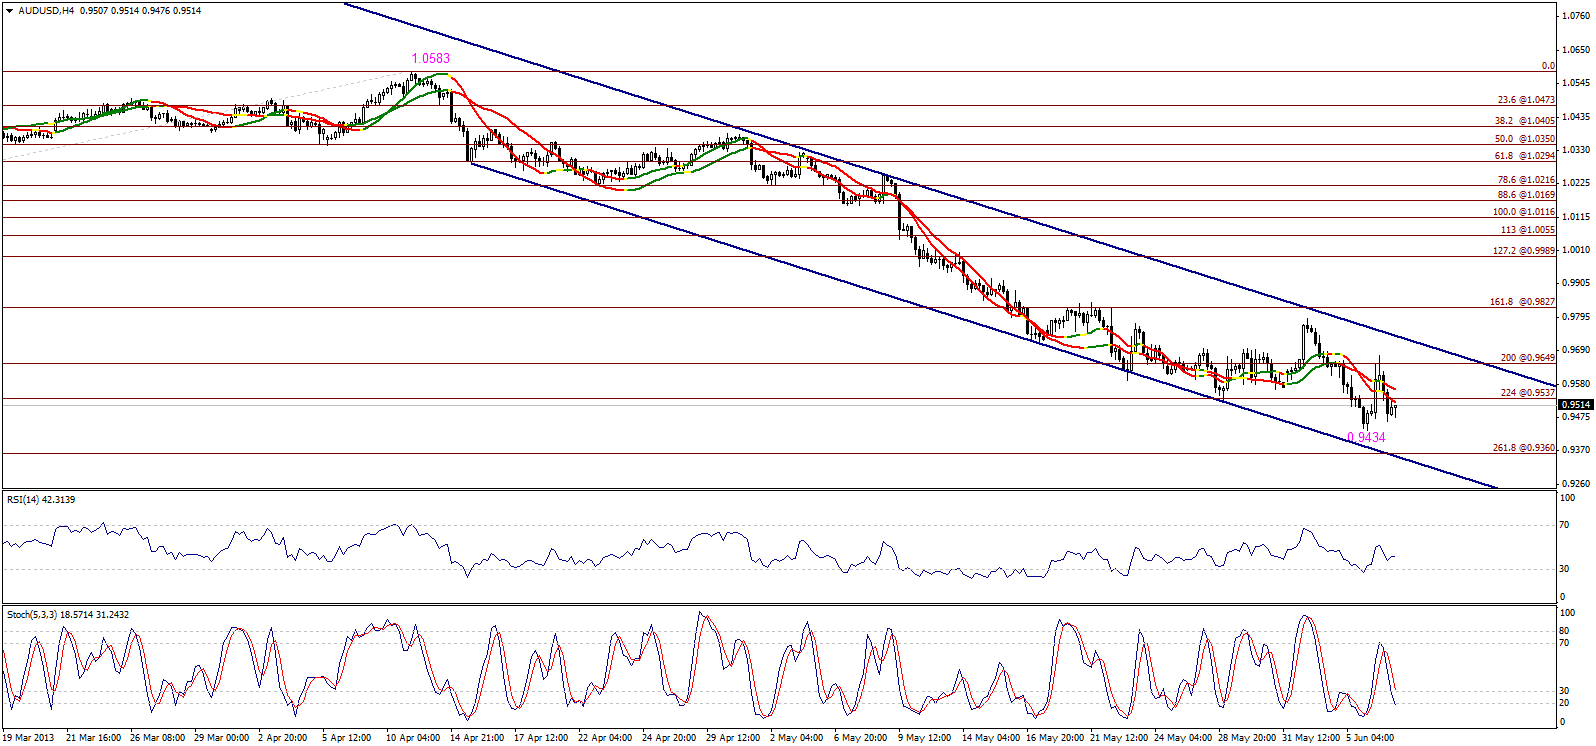 AUD/USD" title="AUD/USD" width="1596" height="746">
The pair was affected by negative pressure as well as the dominating negative momentum affected by the descending channel shown on graph. Stabilizing above 0.9360 levelswas represented in 261.8% Fibonacci, making Risk/Reward Ratio inappropriate.
The trading range was among key support at 0.9260, and key resistance at 0.9690.
The general trend over short term basis was to the downside, with steady daily closing below levels 1.0710 targeting 0.9400. AUD/USD_S&R" title="AUD/USD_S&R" width="635" height="117">
NZD/USD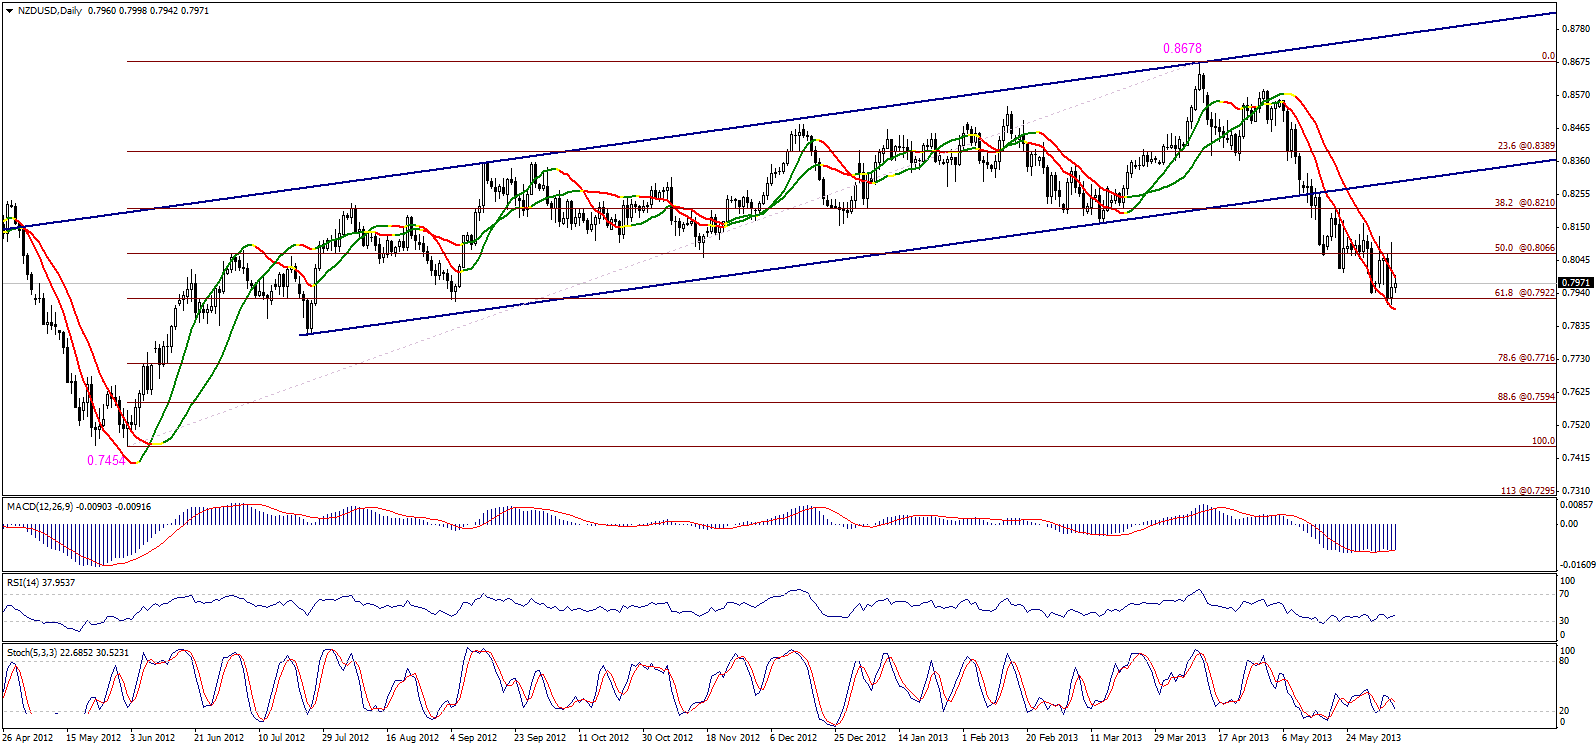 NZD/USD" title="NZD/USD" width="1596" height="746">
The pair consolidated between Linear Regression Indicators 34 and 55, but also above 61.8% correction at 0.7920 levels shown on graph. The possibility of extending bullishness was intraday valid during Friday's U.S. session, unless the pair stabilized below 0.7920.
The trading range might have been among key support at 0.7800 and key resistance at 0.8135.
The general short-term trend was expected to the downside, with daily closing below 0.8400 targeting 0.7715. NZD/USD_S&R" title="NZD/USD_S&R" width="635" height="85">
GBP/JPY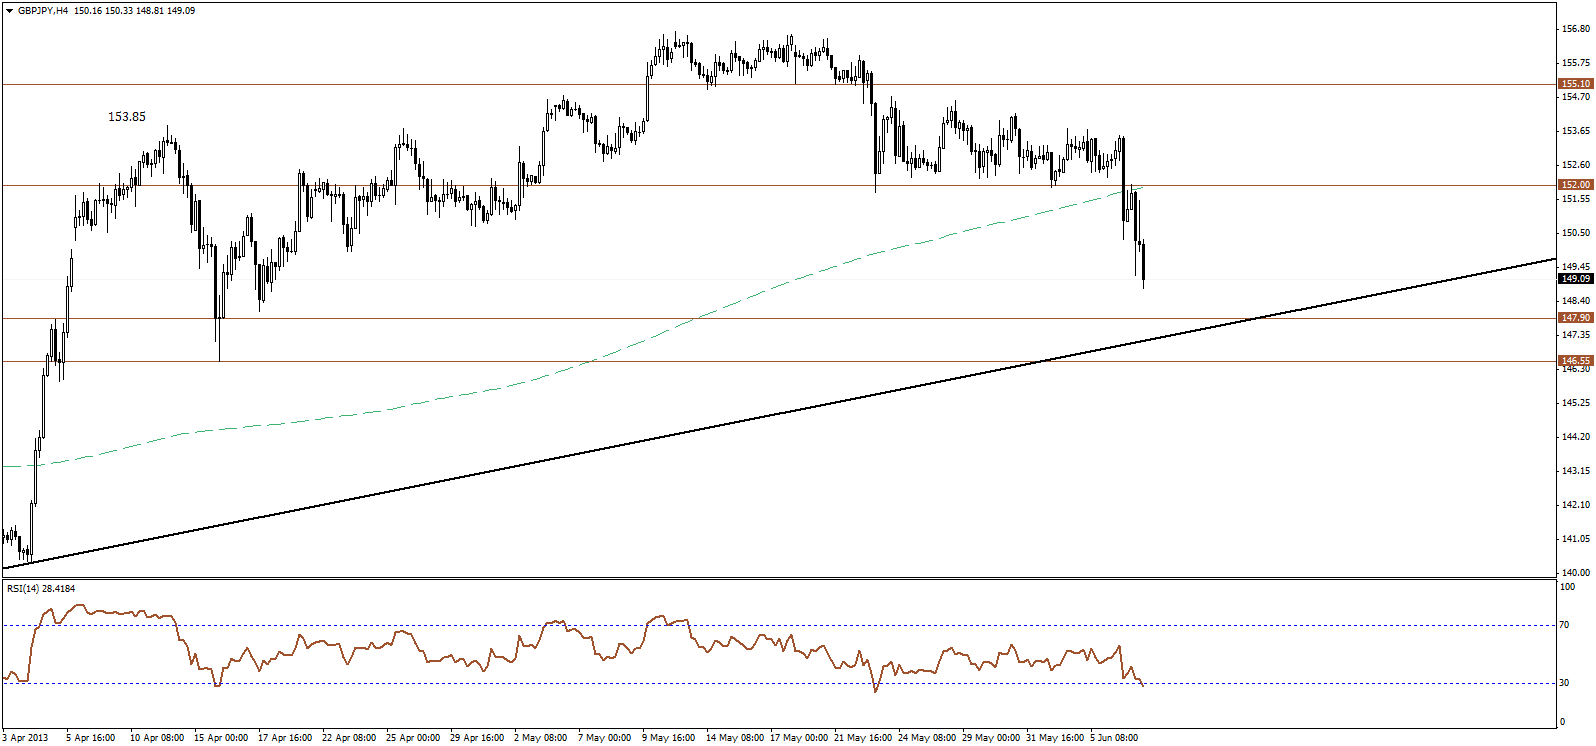 GBP/JPY" title="GBP/JPY" width="1596" height="746">
The GBP/JPY pair resumed the bearish bias, recording new lows and heading towards the main ascending trend line for the bullish trend and 147.90 horizontal support. The bearish bias was expected to continue. GBP/JPY_S&R" title="GBP/JPY_S&R" width="635" height="94">
EUR/JPY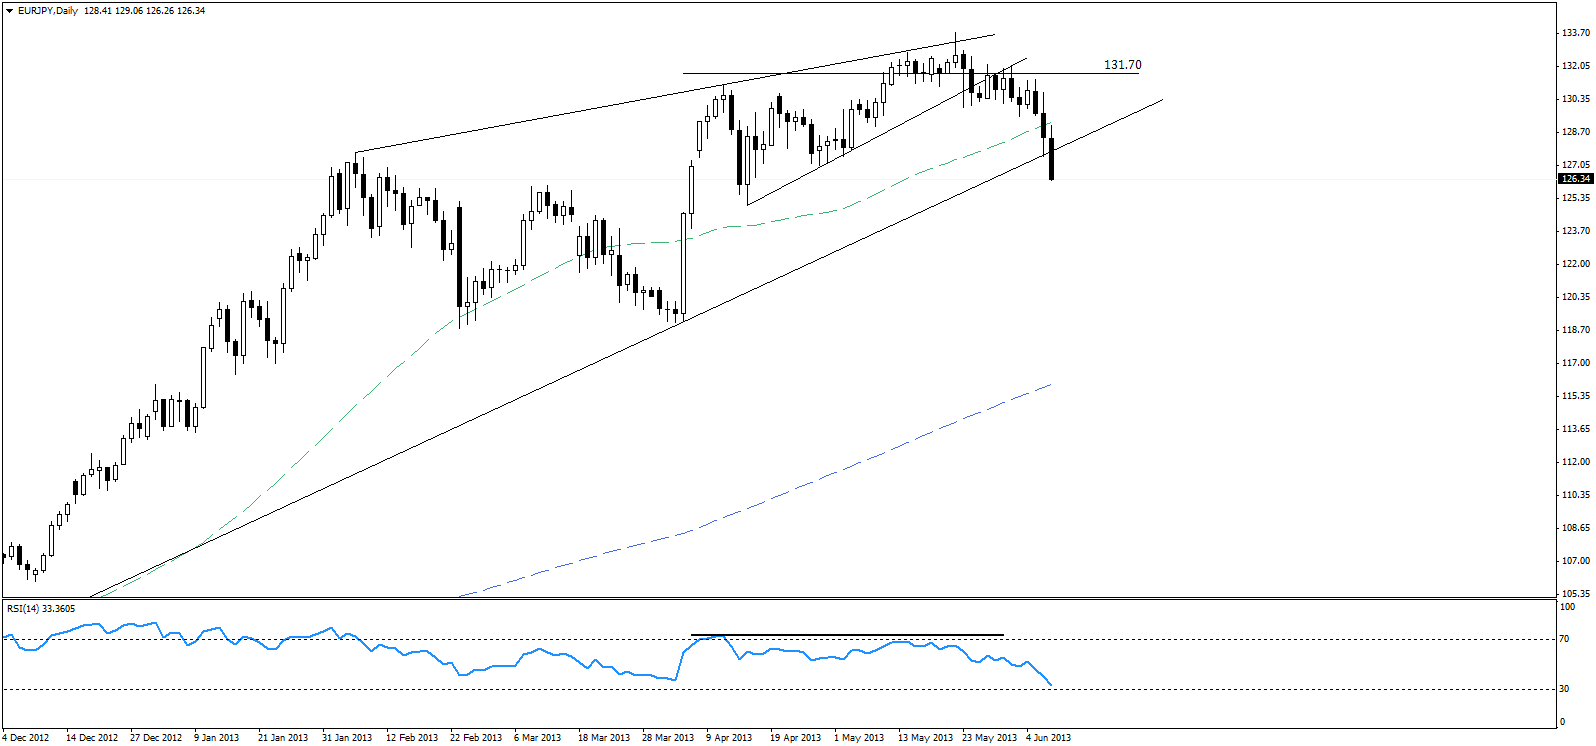 EUR/JPY" title="EUR/JPY" width="1596" height="746">
The EUR/JPY pair plunged, breaking below the main ascending trend line for the bullish trend. Accordingly, the bearish move was expected to continue. EUR/JPY_S&R" title="EUR/JPY_S&R" width="633" height="86">
EUR/GBP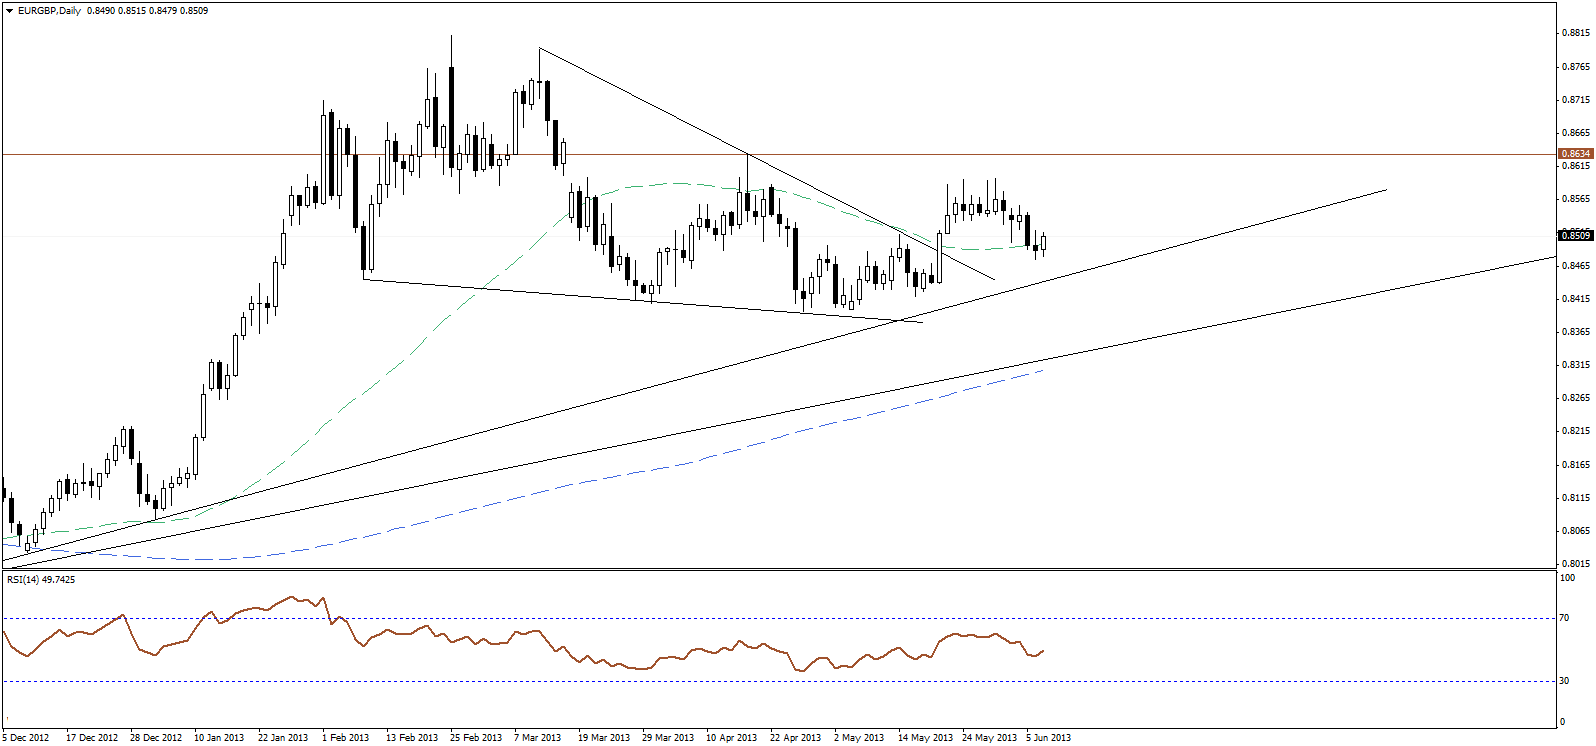 EUR/GBP" title="EUR/GBP" width="1596" height="746">
The pair rebounds above 0.8500 level. Holding back above the 0.8500 level will revive the bullish scenario.  EUR/GBP_S&R" title="EUR/GBP_S&R" width="636" height="85">
- English (UK)
- English (India)
- English (Canada)
- English (Australia)
- English (South Africa)
- English (Philippines)
- English (Nigeria)
- Deutsch
- Español (España)
- Español (México)
- Français
- Italiano
- Nederlands
- Português (Portugal)
- Polski
- Português (Brasil)
- Русский
- Türkçe
- العربية
- Ελληνικά
- Svenska
- Suomi
- עברית
- 日本語
- 한국어
- 简体中文
- 繁體中文
- Bahasa Indonesia
- Bahasa Melayu
- ไทย
- Tiếng Việt
- हिंदी
Daily Technical Report: Major And Cross Currencies - June 7, 2013
Published 06/07/2013, 06:15 AM
Updated 07/09/2023, 06:31 AM
Daily Technical Report: Major And Cross Currencies - June 7, 2013
Latest comments
Loading next article…
Install Our App
Risk Disclosure: Trading in financial instruments and/or cryptocurrencies involves high risks including the risk of losing some, or all, of your investment amount, and may not be suitable for all investors. Prices of cryptocurrencies are extremely volatile and may be affected by external factors such as financial, regulatory or political events. Trading on margin increases the financial risks.
Before deciding to trade in financial instrument or cryptocurrencies you should be fully informed of the risks and costs associated with trading the financial markets, carefully consider your investment objectives, level of experience, and risk appetite, and seek professional advice where needed.
Fusion Media would like to remind you that the data contained in this website is not necessarily real-time nor accurate. The data and prices on the website are not necessarily provided by any market or exchange, but may be provided by market makers, and so prices may not be accurate and may differ from the actual price at any given market, meaning prices are indicative and not appropriate for trading purposes. Fusion Media and any provider of the data contained in this website will not accept liability for any loss or damage as a result of your trading, or your reliance on the information contained within this website.
It is prohibited to use, store, reproduce, display, modify, transmit or distribute the data contained in this website without the explicit prior written permission of Fusion Media and/or the data provider. All intellectual property rights are reserved by the providers and/or the exchange providing the data contained in this website.
Fusion Media may be compensated by the advertisers that appear on the website, based on your interaction with the advertisements or advertisers.
© 2007-2024 - Fusion Media Limited. All Rights Reserved.