
EUR/USD - European Session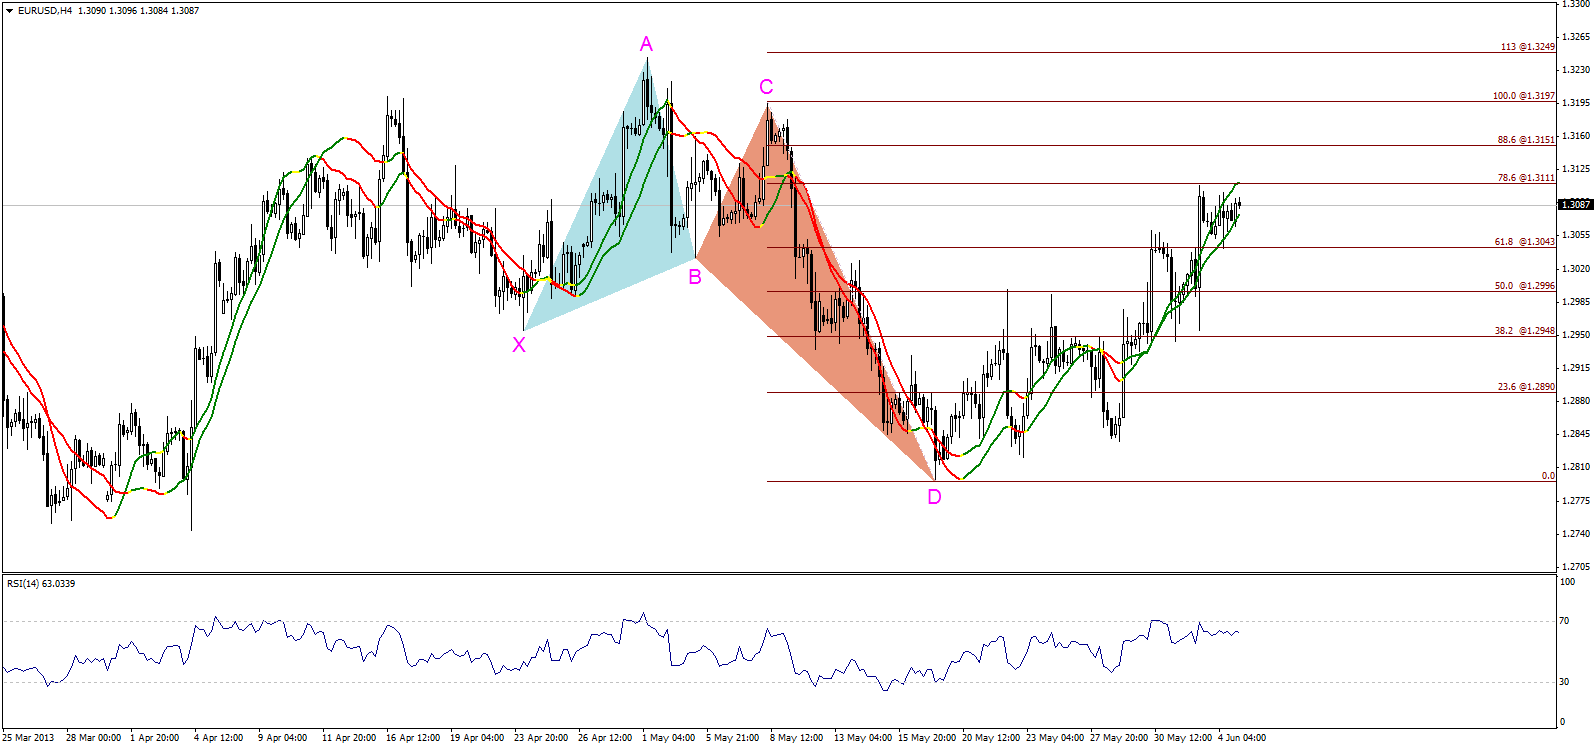 EUR/USD" title="EUR/USD" width="1596" height="746">
The pair is still trading positively, which is normal in light of stabilizing above 61.8% correction of CD Leg of the bullish harmonic Butterfly Pattern residing at 1.3045. Trading above the referred to level triggers a new attempt to breach 78.6% correction at 1.3110 to move towards 1.3150 levels, and perhaps 1.3200.
The trading range for today is among the key support at 1.2960, and key resistance at 1.3200.
The general trend over short term basis is to the downside, targeting 1.2560 as far as areas of 1.3270 remain intact.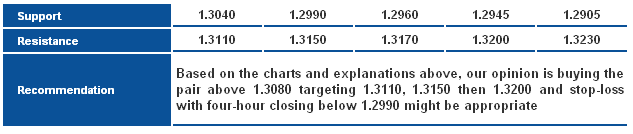 EUR/USD_S&R" title="EUR/USD_S&R" width="633" height="134">
GBP/USD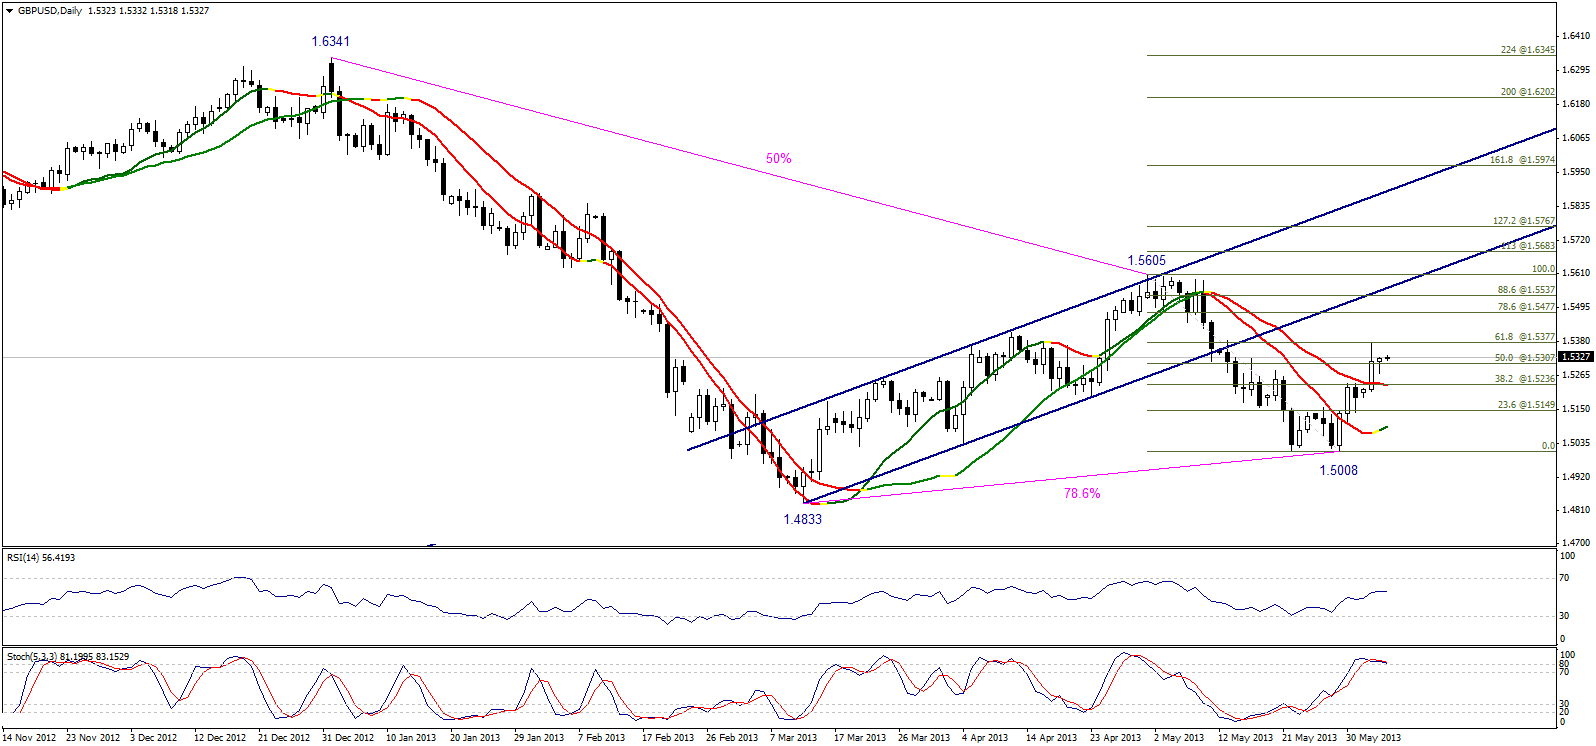 GBP/USD" title="GBP/USD" width="1596" height="746">
Linear Regression Indicator 34 became positive, accompanied by stabilizing above 50% correction at 1.5305 which is positive, supporting the possibility of extending the bullish wave to retest 61.8% correction at 1.5375 – 1.5380. Breaching 61.8% correction might trigger another push to the upside towards 78.6% correction, residing around 1.5480. Positivity for today’s session requires stability above 1.5235, but we prefer to see the pair stabilizing above 1.5305 to further support this outlook.
The trading range for today is among key support at 1.5150, and key resistance at 1.5535.
The general trend over short term basis is to the downside as far as areas of 1.5770 remain intact, targeting 1.4355.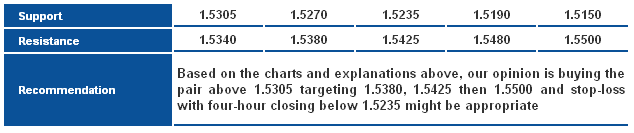 GBP/USD_S&R" title="GBP/USD_S&R" width="634" height="133">
USD/JPY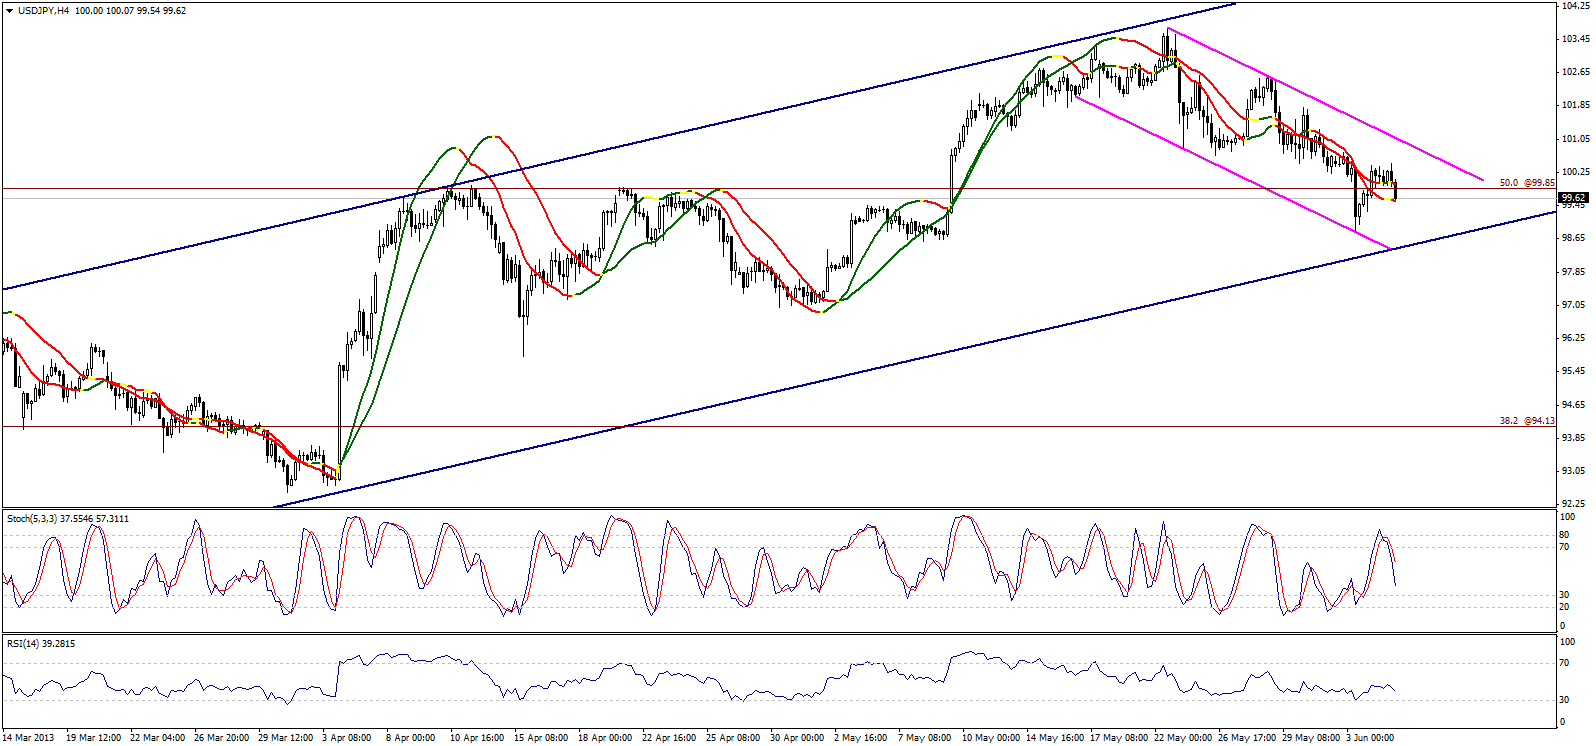 USD/JPY" title="USD/JPY" width="1596" height="746">
By examining the four-hour interval graph, we notice that a descending channel has dominated the pair’s trading since the top formation around 103.7 and is now stable below 99.85, suggesting extending bearishness in a new attempt to test key support level of the overall ascending channel. Stochastic supports the negative expectations as trading below 100.40 will be considered negative today.
The trading range for today is among key support at 98.05, and key resistance at 101.15.
The general trend over short term basis is to the upside as far as areas of 96.50 remain intact, targeting 105.60.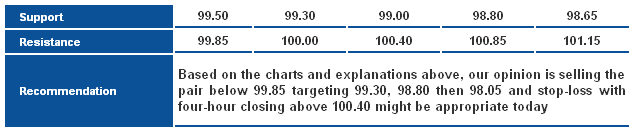 USD/JPY_S&R" title="USD/JPY_S&R" width="636" height="133">
USD/CHF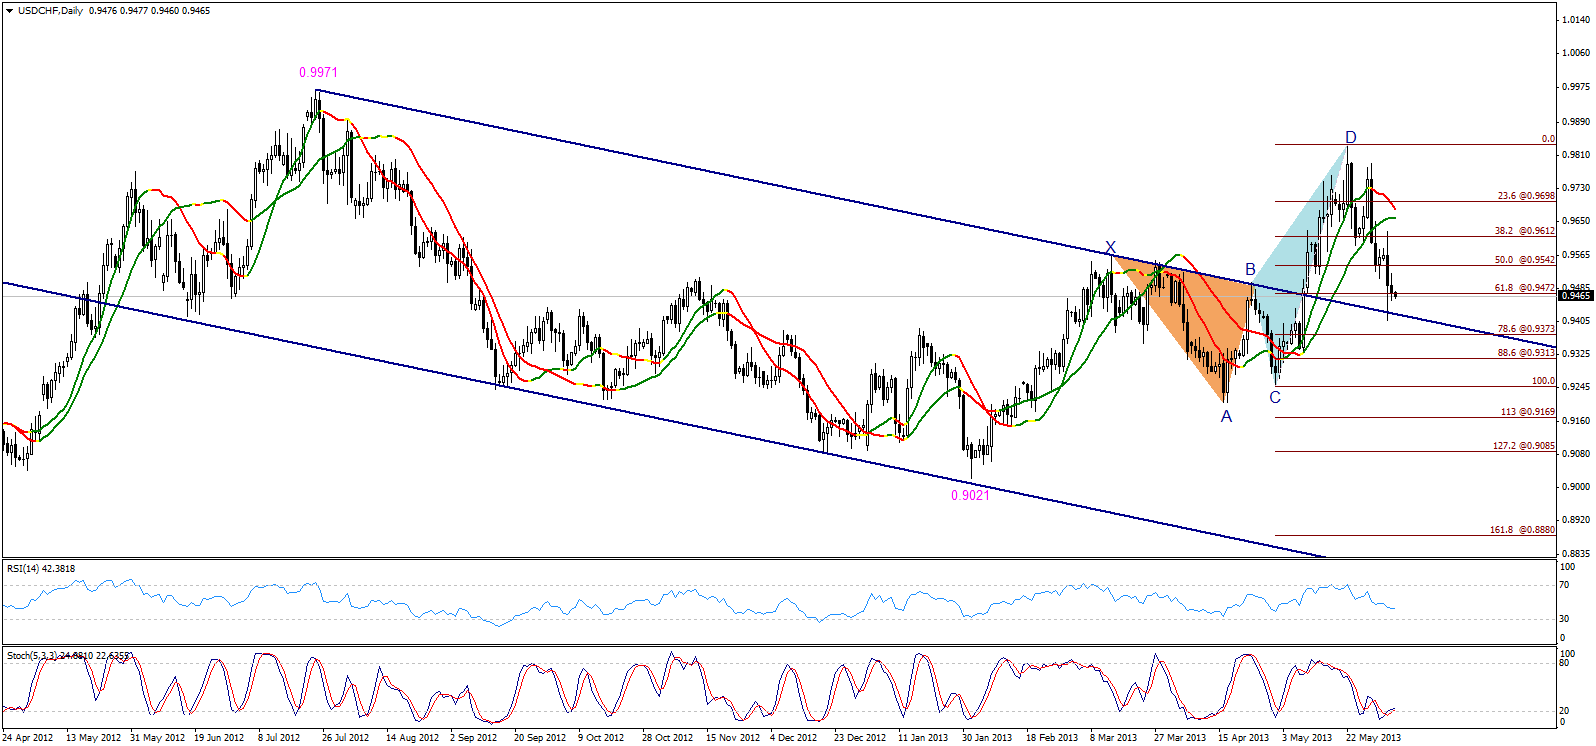 USD/CHF" title="USD/CHF" width="1596" height="746">
The pair is currently trading below the second target of the bearish harmonic Butterfly Pattern, pushing it further to the downside towards testing resistance level of the descending channel that was breached before, in addition to testing 78.6% correction level at 0.9370. Stability below the second target at 0.9475 maintains the possibility of the bearish move during today’s session.
The trading range for today is among key support at 0.9315, and key resistance at 0.9610.
The general trend over short term basis is to the downside stable at levels 0.9775 targeting 0.8860.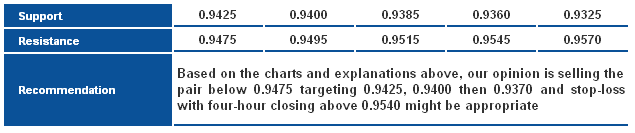 USD/CHF_S&R" title="USD/CHF_S&R" width="635" height="133">
USD/CAD USD/CAD" title="USD/CAD" width="629" height="363">
The pair moved to the upside, and failed to enter a descending wave due to stability of 1.0270 levels. It is now trading above 1.0300, maintaining the possibility of more attempts to the upside. Linear Regression Indicators supports our positive expectations intraday today.
The trading range for today is between the key support at 1.0185, and the key resistance at 1.0540.
The general trend over short term basis is to the upside, with a steady daily closing above levels 0.9800 targeting 1.0485.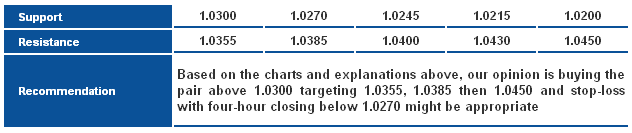 USD/CAD_S&R" title="USD/CAD_S&R" width="632" height="133">
AUD/USD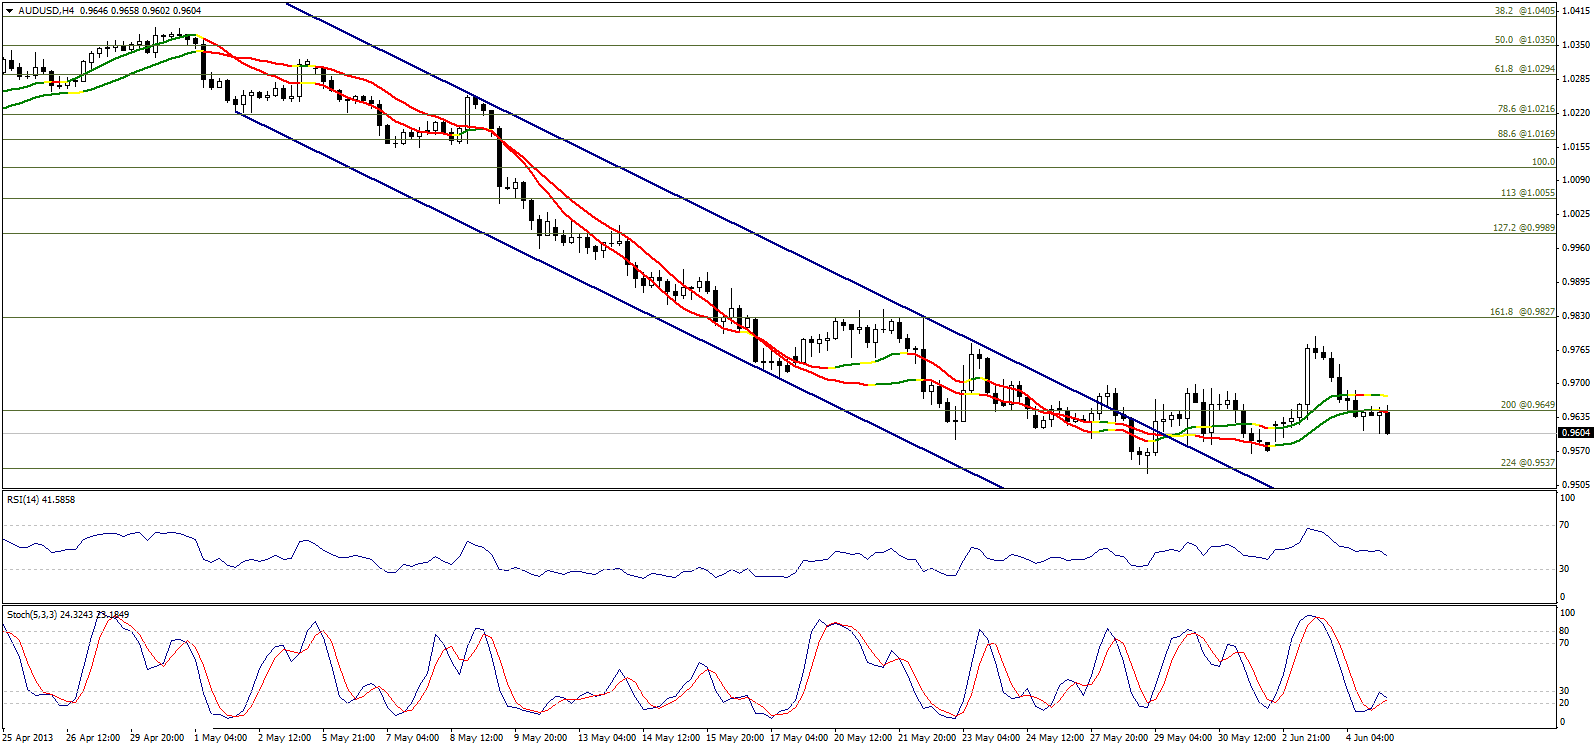 AUD/USD" title="AUD/USD" width="1596" height="746">
The AUD/USD failed to hold above 0.9650, weakening previously-proposed positivity. However, that doesn't confirm triggering a downtrend because it is stable above key 0.9535. Trading between the aforesaid levels compels us to adopt a neutral stance, especially as the relative strength index is inclined to negativity below the 50-point line and Stochastic is reflecting oversold signals.
Today's expected trading range is between the key support at 0.9535, and the key resistance 0.9725.
Short-term trend is downside, targeting 0.9400 if 1.0710 remains intact.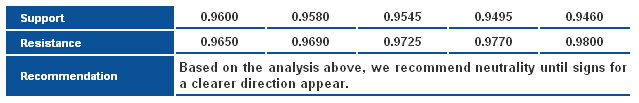 AUD/USD_S&R" title="AUD/USD_S&R" width="639" height="103">
NZD/USD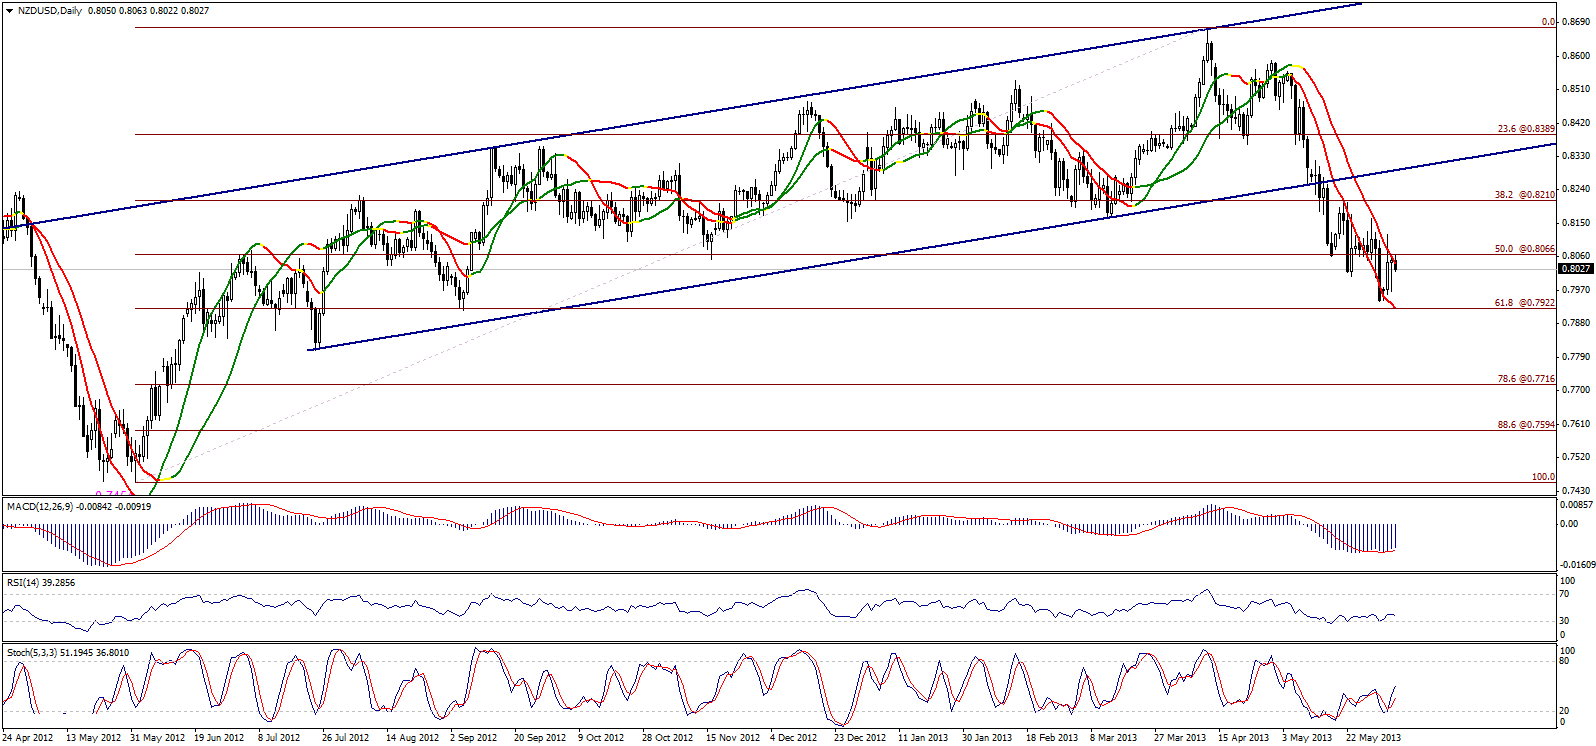 NZD/USD" title="NZD/USD" width="1596" height="746">
The NZD/USD is still steady below 0.8065, 50% correction, despite rather volatile trading. Stability below that level is reason enough to make us hold on to our negative outlook, particularly as the pair trades below linear regression indicator 55, and LRI 34 is still negative.
Trading range expected today is between the key support at 0.7840, and the key resistance 0.8210.
The short-term trend is downside, targeting 0.7715 if 0.8400 remains intact.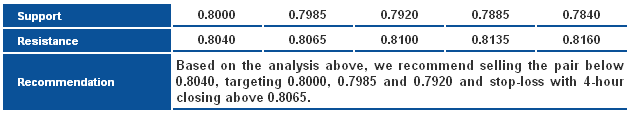 NZD/USD_S&R" title="NZD/USD_S&R" width="636" height="113">
- English (UK)
- English (India)
- English (Canada)
- English (Australia)
- English (South Africa)
- English (Philippines)
- English (Nigeria)
- Deutsch
- Español (España)
- Español (México)
- Français
- Italiano
- Nederlands
- Português (Portugal)
- Polski
- Português (Brasil)
- Русский
- Türkçe
- العربية
- Ελληνικά
- Svenska
- Suomi
- עברית
- 日本語
- 한국어
- 简体中文
- 繁體中文
- Bahasa Indonesia
- Bahasa Melayu
- ไทย
- Tiếng Việt
- हिंदी
Daily Technical Report: Major And Cross Currencies - June 5, 2013
Published 06/05/2013, 06:48 AM
Updated 07/09/2023, 06:31 AM
Daily Technical Report: Major And Cross Currencies - June 5, 2013
Latest comments
Loading next article…
Install Our App
Risk Disclosure: Trading in financial instruments and/or cryptocurrencies involves high risks including the risk of losing some, or all, of your investment amount, and may not be suitable for all investors. Prices of cryptocurrencies are extremely volatile and may be affected by external factors such as financial, regulatory or political events. Trading on margin increases the financial risks.
Before deciding to trade in financial instrument or cryptocurrencies you should be fully informed of the risks and costs associated with trading the financial markets, carefully consider your investment objectives, level of experience, and risk appetite, and seek professional advice where needed.
Fusion Media would like to remind you that the data contained in this website is not necessarily real-time nor accurate. The data and prices on the website are not necessarily provided by any market or exchange, but may be provided by market makers, and so prices may not be accurate and may differ from the actual price at any given market, meaning prices are indicative and not appropriate for trading purposes. Fusion Media and any provider of the data contained in this website will not accept liability for any loss or damage as a result of your trading, or your reliance on the information contained within this website.
It is prohibited to use, store, reproduce, display, modify, transmit or distribute the data contained in this website without the explicit prior written permission of Fusion Media and/or the data provider. All intellectual property rights are reserved by the providers and/or the exchange providing the data contained in this website.
Fusion Media may be compensated by the advertisers that appear on the website, based on your interaction with the advertisements or advertisers.
© 2007-2024 - Fusion Media Limited. All Rights Reserved.