
EUR/USD - Weekly Report EUR/USD" width="1596" height="746">
The pair failed to consolidate above 1.3230, but is stable above 38.2% correction at 1.3115 as shown on graph. Stability above is positive, especially that Linear Regression Indicators tend to be positive. The possibility of extending bullishness is valid this week and the first suggested target resides at 61.8% correction at 1.3345 levels, followed by correction 78.6% at 1.3505 as shown on graph.
The trading range for this week is among the key support at 1.2970, and key resistance at 1.3505.
The general trend over short term basis is to the upside targeting 1.3600, as far as areas of 1.2970 remain intact.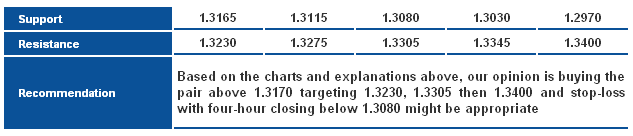 EUR/USD_S&R" title="EUR/USD_S&R" width="633" height="136">
GBP/USD GBP/USD" width="1596" height="746">
The pair is trading below 1.5605 after touching resistance level around 1.5685 last week. The drop is represented as weakness in the bullish momentum on indicators, but Linear Regression Indicators are still positive. The upside move is still valid, as we are facing more bullishness this week, and remains valid by stabilizing above 1.5375 levels.
The trading range for this week is among key support at 1.5305, and key resistance at 1.5770.
The general trend over short term basis is to the upside as far as areas of 1.5150 remain intact, targeting 1.5975.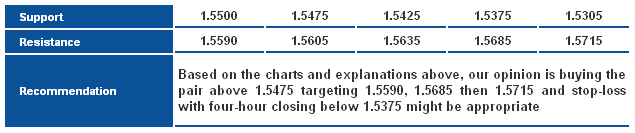 GBP/USD_S&R" title="GBP/USD_S&R" width="635" height="133">
USD/JPY USD/JPY" width="1596" height="746">
The pair moved to the upside last Friday and the beginning of this week’s trading, but is still trading under the previously broken ascending channel. Stability below 99.85 is negative, and might bring the downside move again. Linear Regression Indicators are still negative, supporting our expectations especially that the current bullish move is nothing but a retest of the broken support level of the ascending channel.
The trading range for this week is among key support at 94.10, and key resistance at 102.00.
The general trend over short term basis is to the downside as far as areas of 103.50 remain intact, targeting 93.50.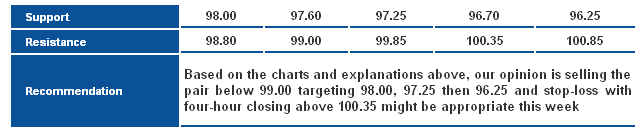 USD/JPY_S&R" title="USD/JPY_S&R" width="643" height="134">
USD/CHF USD/CHF" width="1596" height="746">
The pair failed to stabilize below the ascending key support level shown on graph, and is currently trying to stabilize above 23.6% correction at 0.9370 levels, which might trigger an upside move at the beginning of this week. Failing to breach 0.9460 levels and stabilizing above it keeps the upside move limited, especially that Linear Regression Indicators are still negative.
The trading range for this week is among key support at 0.9080 and key resistance at 0.9605.
The general trend over short term basis is to the downside, stable at levels 0.9775 targeting 0.8860.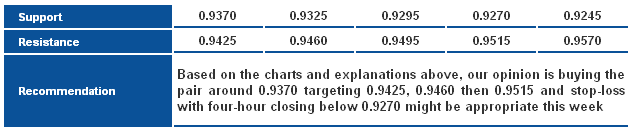 USD/CHF_S&R" title="USD/CHF_S&R" width="633" height="133">
USD/CAD USD/CAD" width="1594" height="718">
The pair dropped last week after failing to stabilize above 1.0270, then touched the 61.8% correction shown on graph. The pair is currently residing in a middle range of the ascending channel keeping the Risk/Reward Ratios inappropriate. We remain neutral in our weekly report.
The trading range for this week is between the key support at 1.0055, and the key resistance at 1.0300.
The general trend over short term basis is to the upside with steady daily closing above levels 0.9800, targeting 1.0485.
AUD/USD AUD/USD" width="1596" height="746">
The AUD/USD price downtrend continues to areas close to 261.8% Fibonacci shown on the graph at 0.9360, while Stochastic is currently reflecting intraday oversold signals. A bullish attempt is likely to take place this week, and the AUD/USD's steady position above 0.9360 can support that attempt. Note that breaking the aforesaid level and settling below it, is sufficient to thwart any bullish movement and creating a powerful downside wave.
Trading range expected this week is between the key support at 0.9140, and the key resistance at 0.9710.
Short-term trend is downside, targeting 0.9000 if 1.0000 remains intact.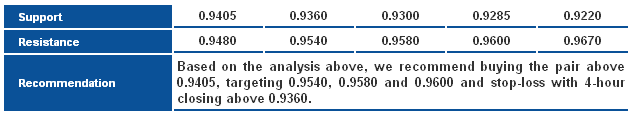 AUD/USD_S&R" title="AUD/USD_S&R" width="633" height="114">
NZD/USD NZD/USD" width="1596" height="746">
The NZD/USD has broken and stabilized below 61.8% correction, according to Fibonacci retracements. It could be a reason for a downtrend all the way to 78.6% correction at around 0.7715, perhaps even as far as 0.7590 later. Trading below 0.7925 nurtures the negative outlook throughout the week.
Trading range expected this week is between the key support at 0.7590, and the key resistance at 0.8065.
Short-term trend is downside, targeting 0.7715 if 0.8400 remains intact.
GBP/JPY GBP/JPY" width="1596" height="762">
The pair achieved the latest suggested negative scenario. It approached 148.00 levels, then rebounded sharply to the upside, stabilizing above 152.00. Some intraday bullish momentum is likely targeting 155.10, while breaking 152.00 will bring the downside move back.
EUR/JPY EUR/JPY" width="1596" height="762">
The pair remained stable above support level of the upside move, indicating the possibility of positive trading in the upcoming period. Breaching 131.70 levels will push the pair towards 133.80, while breaking 128.00 will push the pair to trade to the downside.
EUR/GBP EUR/GBP" width="1596" height="762">
The pair is still trading above the ascending trend line shown on graph, where we expect positive trading on the intraday and medium term. Breaching 0.8635 levels will confirm extending the expected upside move. The initial targets reside at 0.8790, whereas achieving it requires stability above 0.8455 and 0.8345 levels.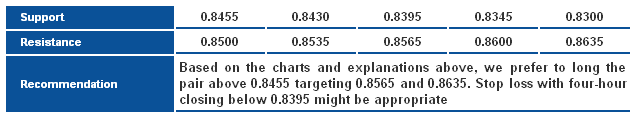 EUR/GBP_S&R" title="EUR/GBP_S&R" width="638" height="120">
- English (UK)
- English (India)
- English (Canada)
- English (Australia)
- English (South Africa)
- English (Philippines)
- English (Nigeria)
- Deutsch
- Español (España)
- Español (México)
- Français
- Italiano
- Nederlands
- Português (Portugal)
- Polski
- Português (Brasil)
- Русский
- Türkçe
- العربية
- Ελληνικά
- Svenska
- Suomi
- עברית
- 日本語
- 한국어
- 简体中文
- 繁體中文
- Bahasa Indonesia
- Bahasa Melayu
- ไทย
- Tiếng Việt
- हिंदी
Daily Technical Report: Major And Cross Currencies - June 10, 2013
Published 06/10/2013, 08:07 AM
Updated 07/09/2023, 06:31 AM
Daily Technical Report: Major And Cross Currencies - June 10, 2013
Latest comments
Loading next article…
Install Our App
Risk Disclosure: Trading in financial instruments and/or cryptocurrencies involves high risks including the risk of losing some, or all, of your investment amount, and may not be suitable for all investors. Prices of cryptocurrencies are extremely volatile and may be affected by external factors such as financial, regulatory or political events. Trading on margin increases the financial risks.
Before deciding to trade in financial instrument or cryptocurrencies you should be fully informed of the risks and costs associated with trading the financial markets, carefully consider your investment objectives, level of experience, and risk appetite, and seek professional advice where needed.
Fusion Media would like to remind you that the data contained in this website is not necessarily real-time nor accurate. The data and prices on the website are not necessarily provided by any market or exchange, but may be provided by market makers, and so prices may not be accurate and may differ from the actual price at any given market, meaning prices are indicative and not appropriate for trading purposes. Fusion Media and any provider of the data contained in this website will not accept liability for any loss or damage as a result of your trading, or your reliance on the information contained within this website.
It is prohibited to use, store, reproduce, display, modify, transmit or distribute the data contained in this website without the explicit prior written permission of Fusion Media and/or the data provider. All intellectual property rights are reserved by the providers and/or the exchange providing the data contained in this website.
Fusion Media may be compensated by the advertisers that appear on the website, based on your interaction with the advertisements or advertisers.
© 2007-2024 - Fusion Media Limited. All Rights Reserved.