
EUR/USD - Weekly Report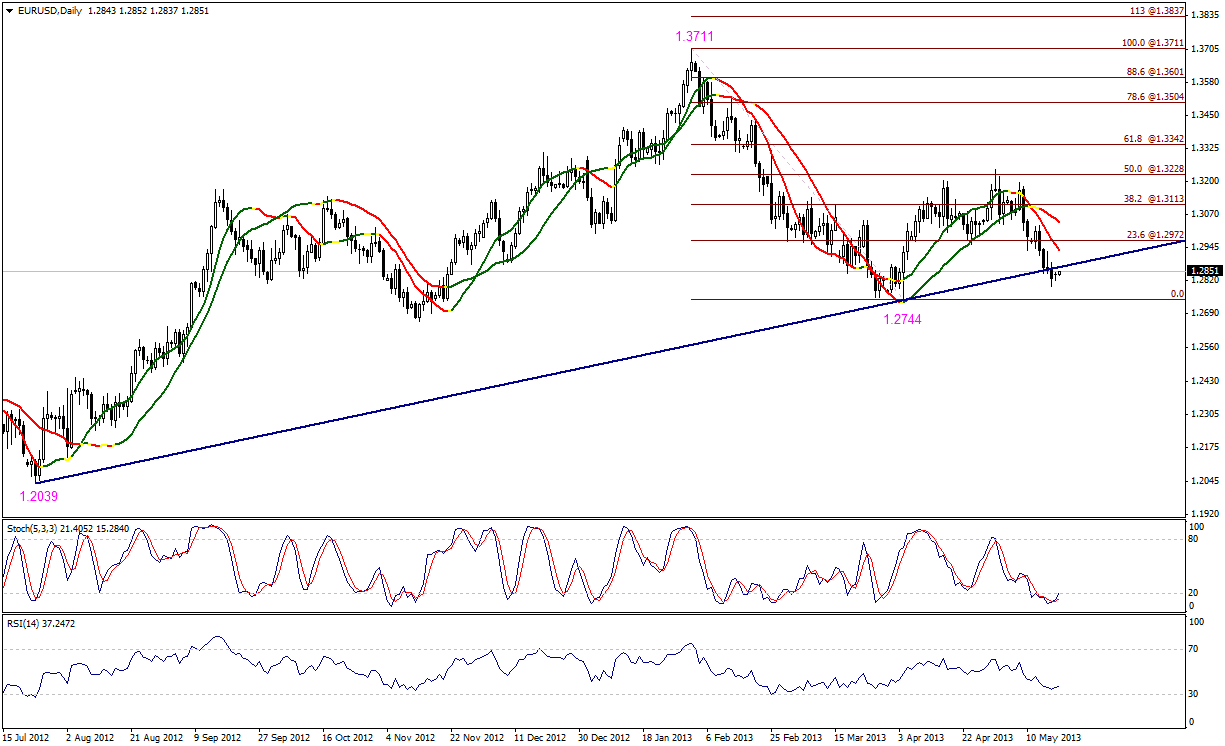 EUR/USD" title="EUR/USD" width="1225" height="746">
This week’s trading started to the upside, but we find it stable below key support level of the bullish move that was broken earlier as shown on graph. Trading below 1.2970 this week keeps the possibility of extending the downside move in an attempt to touch 1.2744 levels, as breaking it might trigger a new bearish wave. Linear Regression Indicators supports our expectations, but Stochastic is showing oversold signals which we will ignore unless the pair breach and stabilize above 1.2970 levels.
The trading range for this week is among the key support at 1.2560 and key resistance at 1.3030.
The general trend over short term basis is to the downside targeting 1.2560 as far as areas of 1.3270 remains intact.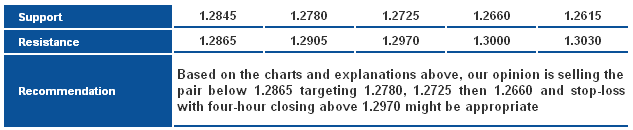 EUR/USD_S&R" title="EUR/USD_S&R" width="633" height="130">
GBP/USD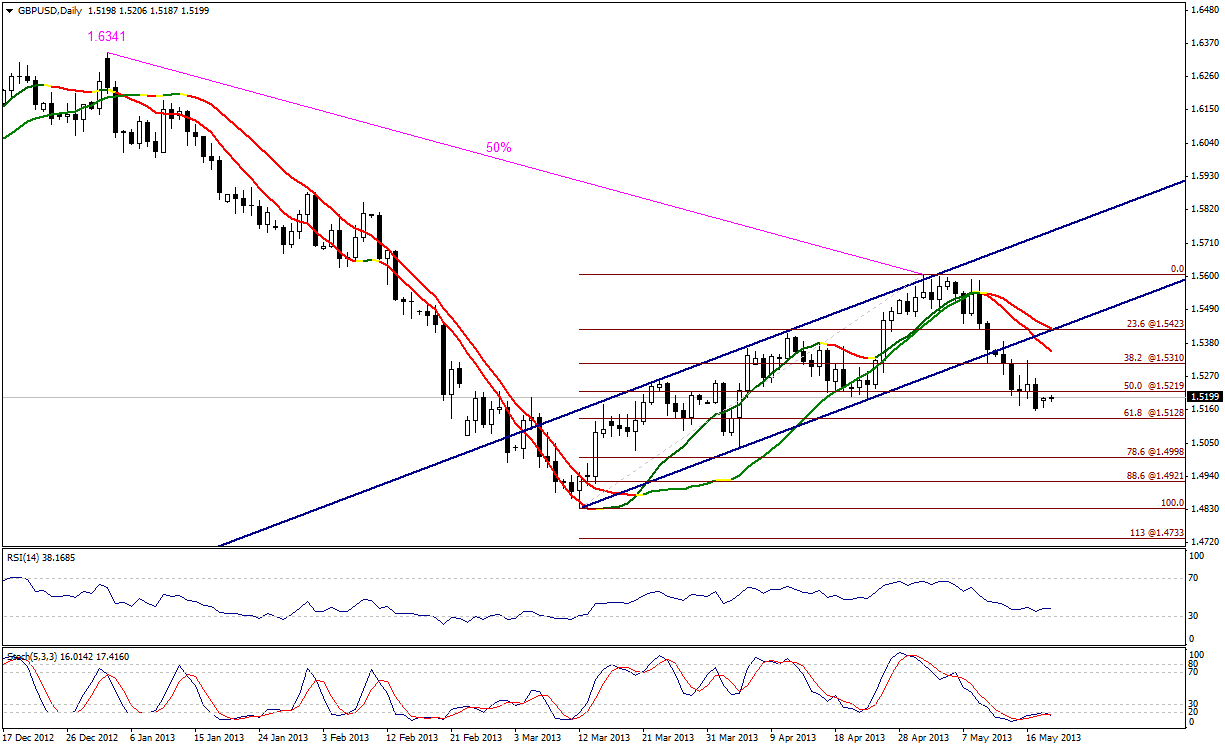 GBP/USD" title="GBP/USD" width="1225" height="746">
The pair managed last week to confirm breaking 50% correction at 1.5220 which might extend bearishness towards testing 61.8% correction at 1.5125, as breaking it might extend the downside move towards 78.6% correction at 1.4995 levels. The possibility of negativity is valid and Linear Regression Indicators support this outlook; there are no positive signals shown on Stochastic despite the oversold signals.
The trading range for this week is among key support at 1.4995 and key resistance at 1.5385.
The general trend over short term basis is to the downside as far as areas of 1.5610 remains intact targeting 1.4920.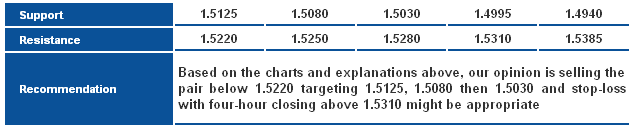 GBP/USD_S&R" title="GBP/USD_S&R" width="634" height="130">
USD/JPY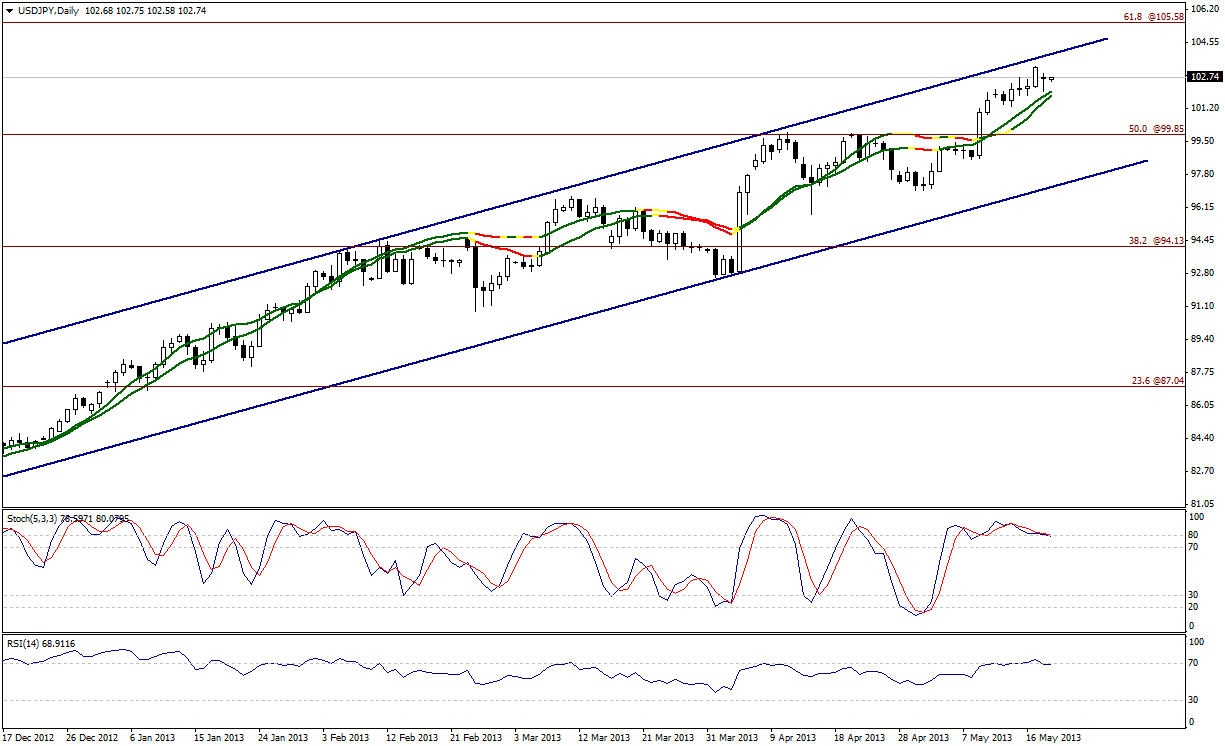 USD/JPY" title="USD/JPY" width="1225" height="746">
This week’s trading started to the downside with great volatility but is limited above Linear Regression Indicators. Stability above Linear Regression Indicators keep the possibility of an upside move in an attempt to test key resistance level of the ascending channel as shown on graph, which means testing levels around 104.00. Stability above 101.70 is necessary to keep our positive outlook.
The trading range for this week is among key support at 100.35 and key resistance at 105.05.
The general trend over short term basis is to the upside as far as areas of 97.00 remain intact targeting 105.60.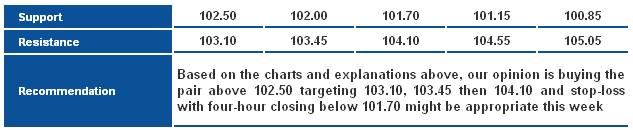 USD/JPY_S&R" title="USD/JPY_S&R" width="633" height="130">
USD/CHF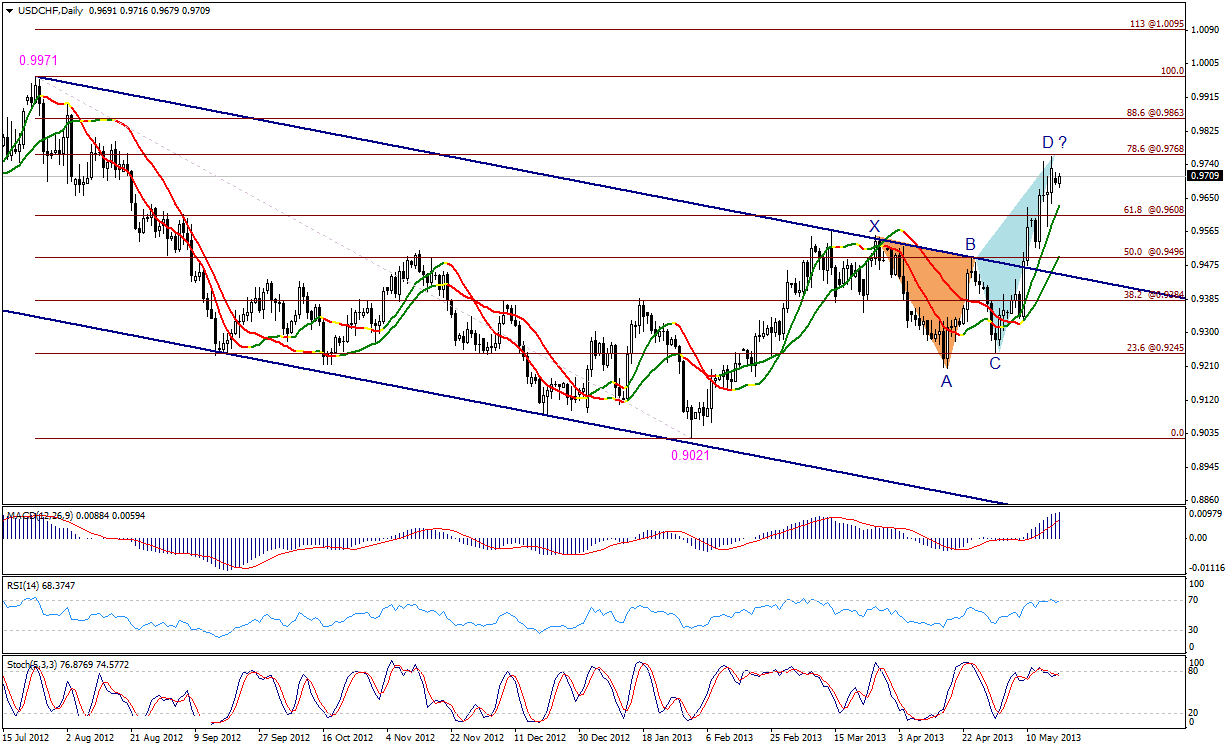 USD/CHF" title="USD/CHF" width="1225" height="746">
A bearish harmonic Butterfly Pattern might form around 0.9770 levels. Meanwhile, the pair is still trading positively benefiting from breaching key resistance level of descending channel earlier; Linear Regression Indicators also support the upside move. Hence, levels 0.9770 are considered an interval of the week’s trading trend as we need to see how the pair would react around it forcing us to prefer to be intraday neutral in our weekly report waiting for confirmation signals.
The trading range for this week is among key support at 0.9495 and key resistance at 0.9970.
The general trend over short term basis is to the downside stable at levels 0.9775 targeting 0.8860.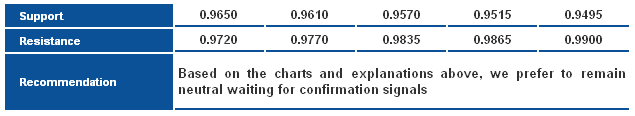 USD/CHF_S&R" title="USD/CHF_S&R" width="635" height="116">
USD/CAD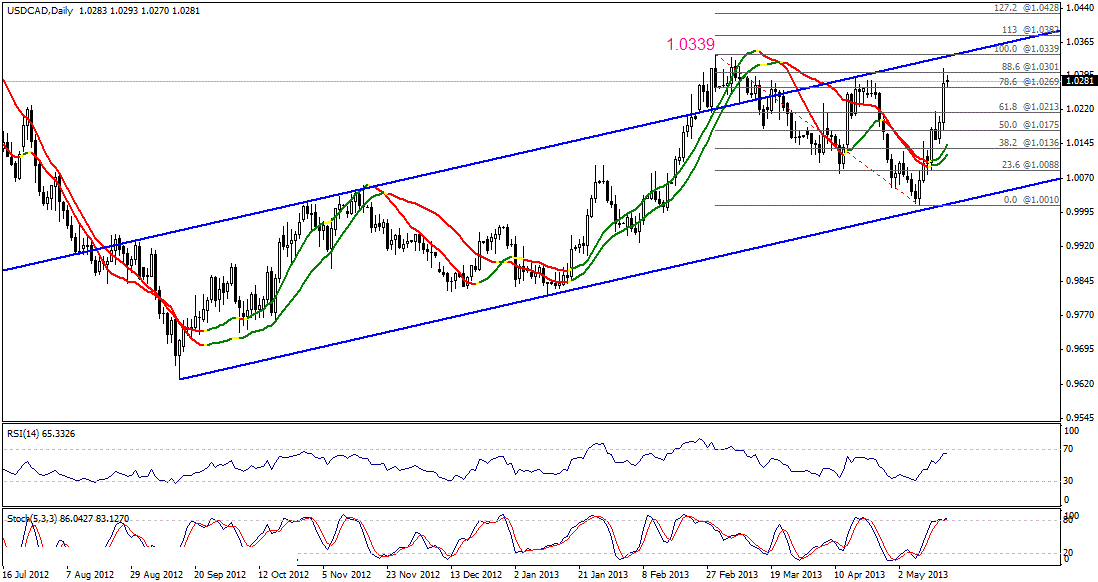 USD/CAD" title="USD/CAD" width="640" height="385">
The pair moved to the upside sharply last week and approaching key resistance of the ascending channel around 1.0339. Breaching 1.0339 might push the pair further to the upside toward 1.0430 levels. Linear Regression Indicators support the possibility of an upside move this week as far as 1.0175 holds.
The trading range for this week is between the key support at 1.0140 and the key resistance at 1.0540.
The general trend over short term basis is to the upside with steady daily closing above levels 0.9800 targeting 1.0485.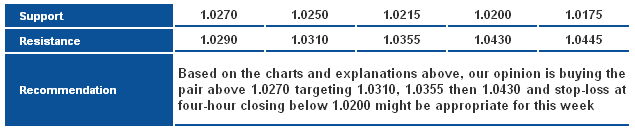 USD/CAD_S&R" title="USD/CAD_S&R" width="635" height="133">
AUD/USD AUD/USD" title="AUD/USD" width="635" height="520">
AUD/USD plunged nonstop, breaking 161.8% Fibonacci at 0.9825. Settling below this level could extend the downtrend toward 200% Fibonacci and perhaps 224% at 0.9645 and 0.9535 respectively. Stability below 0.9825 supports negativity but breaching 0.9900 could put off the expected downtrend.
- Trading range expected this week is between the key support at 0.9535 and the key resistance 0.9935.
- Short-term trend is donwside targeting 0.9400 if 1.0710 remains intact. AUD/USD_S&R" title="AUD/USD_S&R" width="636" height="117">
NZD/USD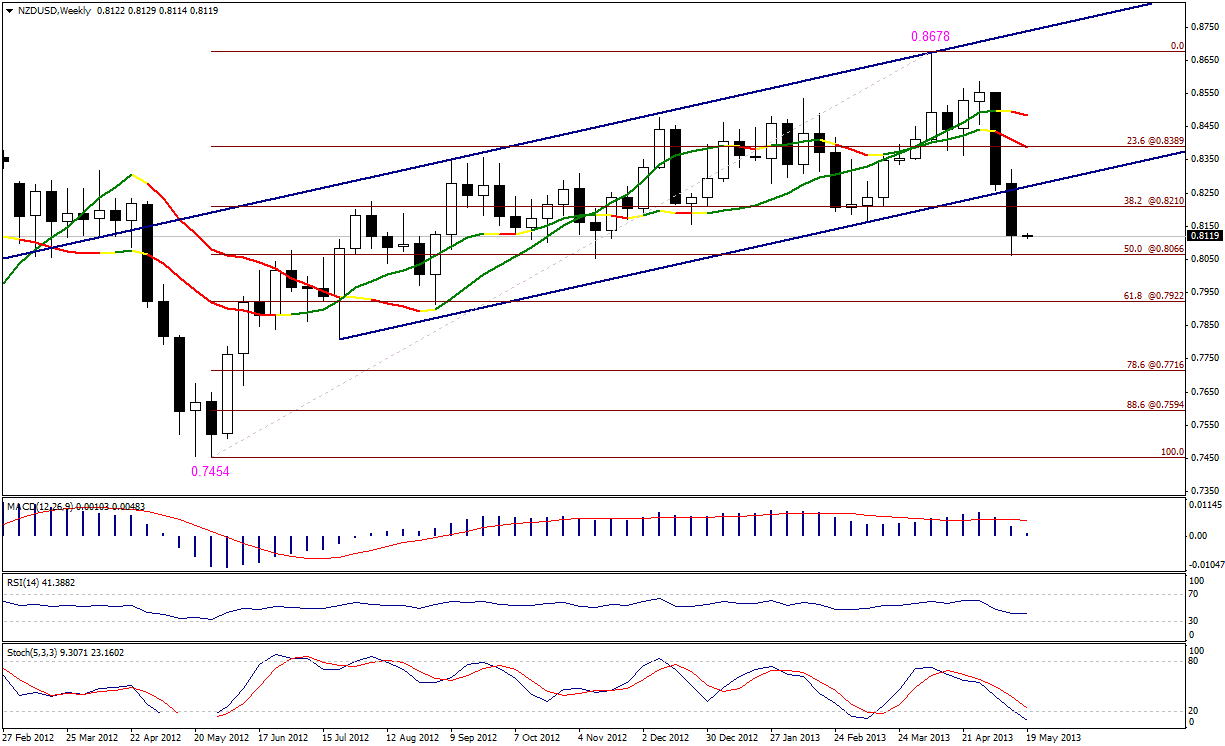 NZD/USD" title="NZD/USD" width="1225" height="746">
The NZD/USD broke the long-term ascending channel's key support, making us expect the downtrend, which dominated for the past two weeks, is not sufficient to complete overall bearishness. The pair is steady below 0.8210, or 38.2% Fibonacci correction, allowing the downtrend to extend to 0.7920 at 61.8% correction, passing by 0.8065 at 50% correction. Note that breaking the latter is important to stimulate the intraday downtrend's continuation.
- Trading range expected this week is between the key support at 0.7920 and the key resistance 0.8355.
- Short-term trend is bullish targeting 0.8845 if 0.8130 remains intact on daily basis.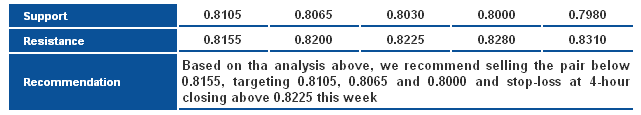 NZD/USD_S&R" title="NZD/USD_S&R" width="641" height="115">
GBP/JPY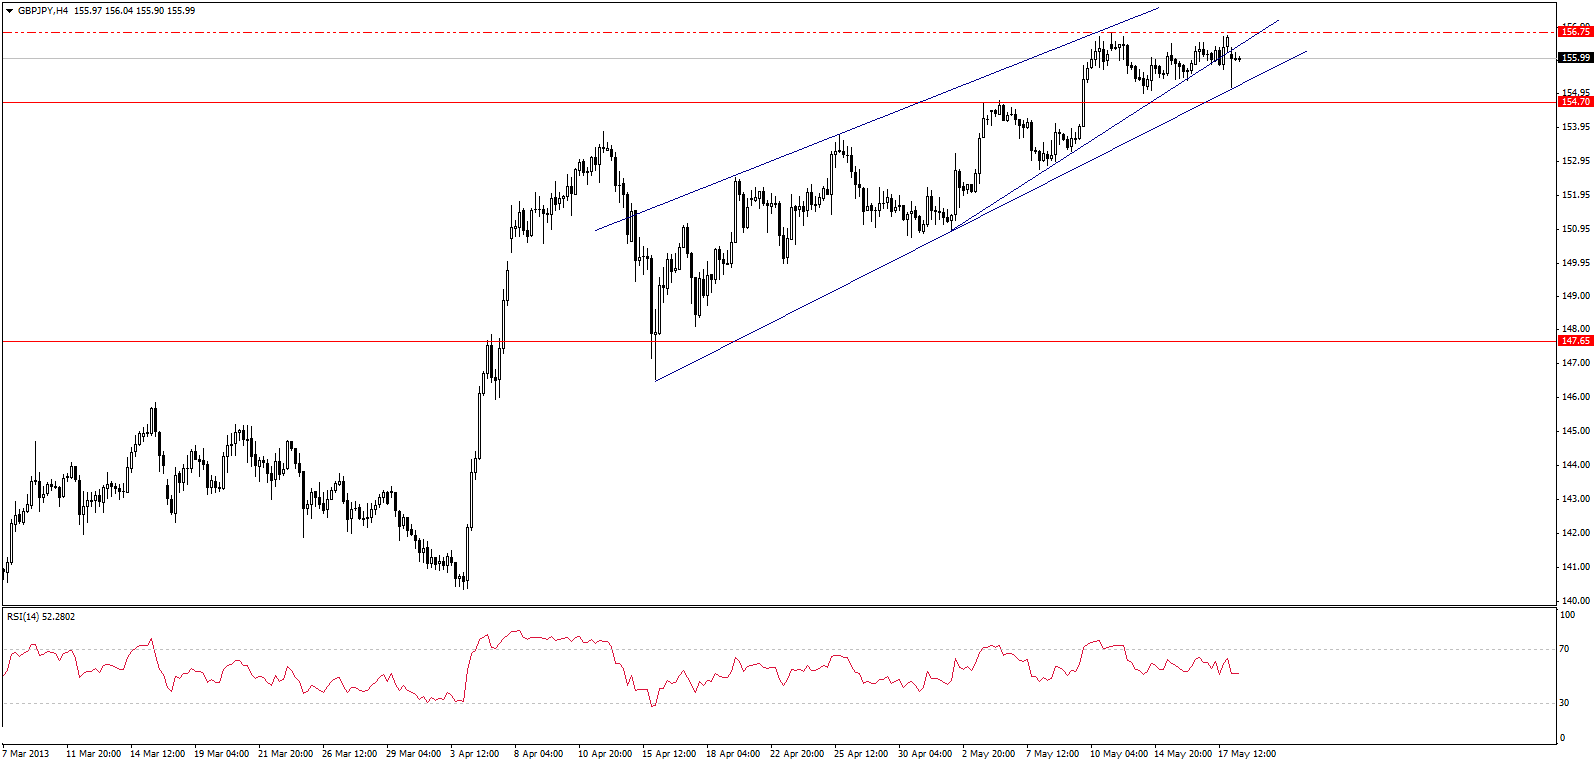 GBP/JPY" title="GBP/JPY" width="1596" height="762">
GBP/JPY touched the bearish channel's support, shown on graph, but is steadying above it. That helps us maintain previous expectations of the uptrend, targeting 156.75. If that level is breached, the path will be cleared for the pair to head towards 158.30.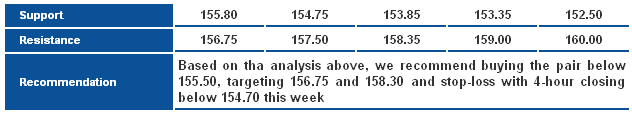 GBP/JPY_S&R" title="GBP/JPY_S&R" width="632" height="115">
EUR/JPY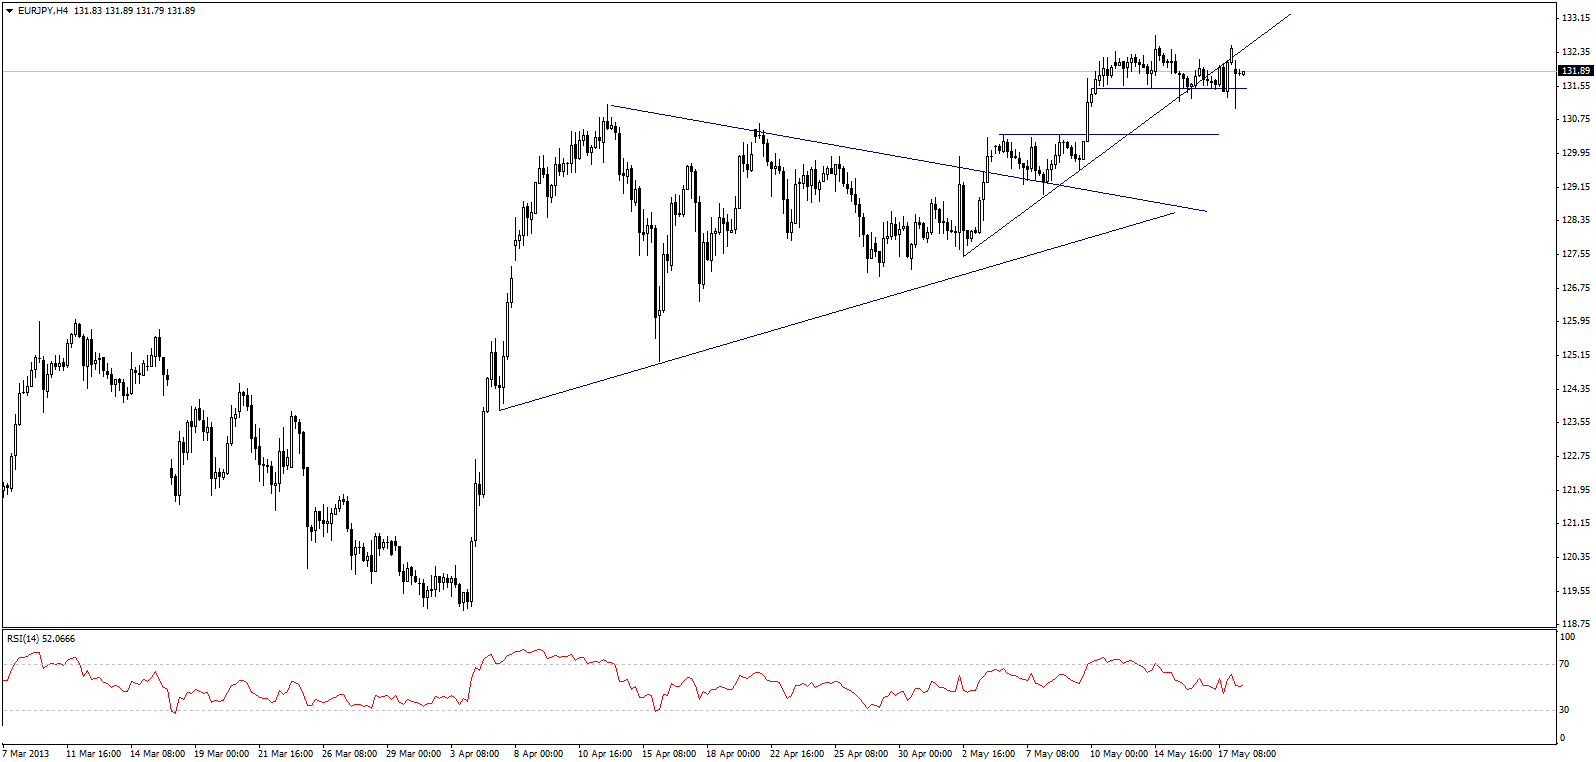 EUR/JPY" title="EUR/JPY" width="1596" height="762">
The EUR/JPY continues to be volatile above 131.50, level of a solid support over intraday basis, as it attempts to exceed the 132.50 barrier. We prefer to stand aside waiting to see how the pair behaves at the aforesaid levels.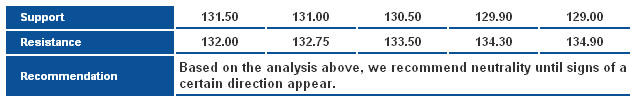 EUR/JPY_S&R" title="EUR/JPY_S&R" width="636" height="102">
EUR/GBP
The EUR/GBP still suffers the negative pressure the upper line, or resistance, of the downtrend is applying. That helps us maintain expectations of the downtrend over intraday basis, which stands valid as long as the trading remains below 0.8500.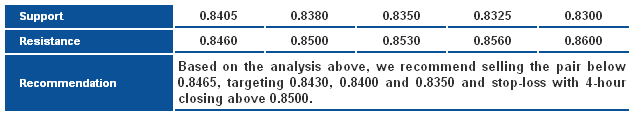 EUR/GBP_S&R" title="EUR/GBP_S&R" width="635" height="116">
- English (UK)
- English (India)
- English (Canada)
- English (Australia)
- English (South Africa)
- English (Philippines)
- English (Nigeria)
- Deutsch
- Español (España)
- Español (México)
- Français
- Italiano
- Nederlands
- Polski
- Português (Portugal)
- Português (Brasil)
- Русский
- Türkçe
- العربية
- Ελληνικά
- Svenska
- Suomi
- עברית
- 日本語
- 한국어
- 简体中文
- 繁體中文
- Bahasa Indonesia
- Bahasa Melayu
- ไทย
- Tiếng Việt
- हिंदी
Daily Technical Report: EUR/USD Trading To The Upside
Published 05/20/2013, 02:57 AM
Updated 07/09/2023, 06:31 AM
Daily Technical Report: EUR/USD Trading To The Upside
Latest comments
Loading next article…
Install Our App
Risk Disclosure: Trading in financial instruments and/or cryptocurrencies involves high risks including the risk of losing some, or all, of your investment amount, and may not be suitable for all investors. Prices of cryptocurrencies are extremely volatile and may be affected by external factors such as financial, regulatory or political events. Trading on margin increases the financial risks.
Before deciding to trade in financial instrument or cryptocurrencies you should be fully informed of the risks and costs associated with trading the financial markets, carefully consider your investment objectives, level of experience, and risk appetite, and seek professional advice where needed.
Fusion Media would like to remind you that the data contained in this website is not necessarily real-time nor accurate. The data and prices on the website are not necessarily provided by any market or exchange, but may be provided by market makers, and so prices may not be accurate and may differ from the actual price at any given market, meaning prices are indicative and not appropriate for trading purposes. Fusion Media and any provider of the data contained in this website will not accept liability for any loss or damage as a result of your trading, or your reliance on the information contained within this website.
It is prohibited to use, store, reproduce, display, modify, transmit or distribute the data contained in this website without the explicit prior written permission of Fusion Media and/or the data provider. All intellectual property rights are reserved by the providers and/or the exchange providing the data contained in this website.
Fusion Media may be compensated by the advertisers that appear on the website, based on your interaction with the advertisements or advertisers.
© 2007-2024 - Fusion Media Limited. All Rights Reserved.