
EUR/USD - European Session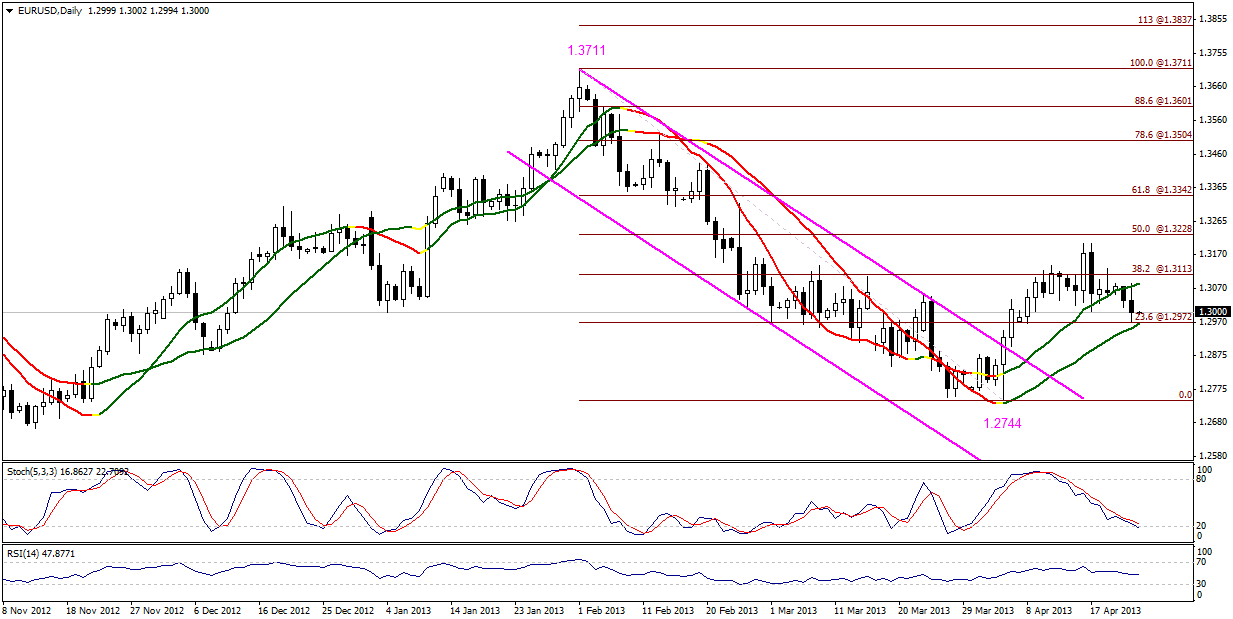 EUR/USD" title="EUR/USD" width="1233" height="619">
The pair sharply dropped yesterday but remained limited above support level 1.2970, as stability above this level represented in 23.6% correction shown on graph supports the return of the bullish move. Linear Regression Indicators are positive, as Stochastic is getting close to oversold areas. Therefore, we will hold on to our positive expectations if the pair remained stable above 1.2970 levels.
The trading range for today is among the key support at 1.2880 and key resistance at 1.3155.
The general trend over short term basis is to the downside targeting 1.2560 as far as areas of 1.3270 remains intact.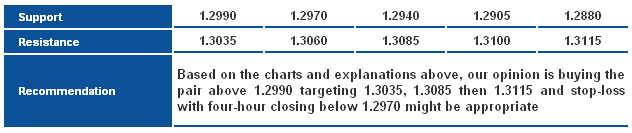 EUR/USD_S&R" title="EUR/USD_S&R" width="632" height="133">
GBP/USD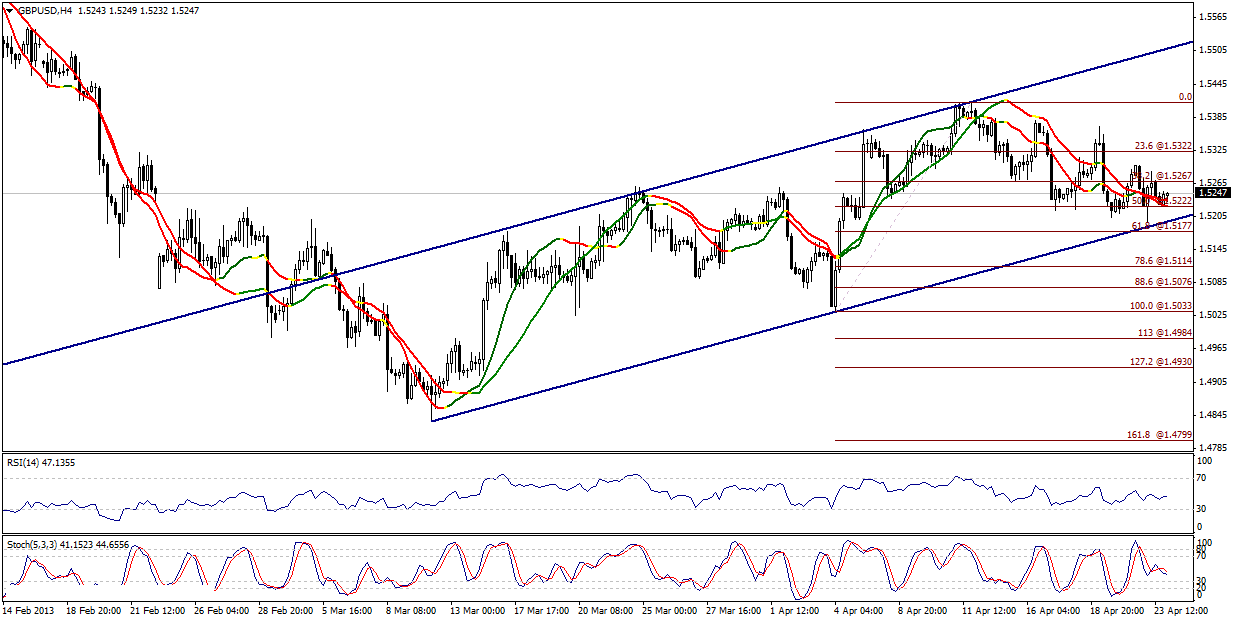 GBP/USD" title="GBP/USD" width="1233" height="619">
The pair is trading above key support level of the upside move and above 50% correction at 1.5220 today, giving the possibility of rising especially that the pair is trading above Linear Regression Indicators despite its negativity. Risk/Reward Ratios indicates a possibility of moving to the upside today, but the pair has to stable above 1.5270 later to further trigger the suggested bullish move.
The trading range for today is among key support at 1.5115 and key resistance at 1.5385.
The general trend over short term basis is to the downside as far as areas of 1.6875 remains intact targeting 1.4225.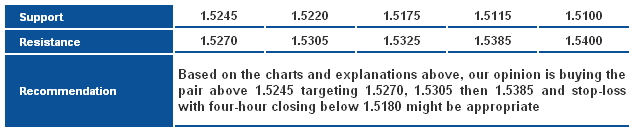 GBP/USD_S&R" title="GBP/USD_S&R" width="632" height="132">
USD/JPY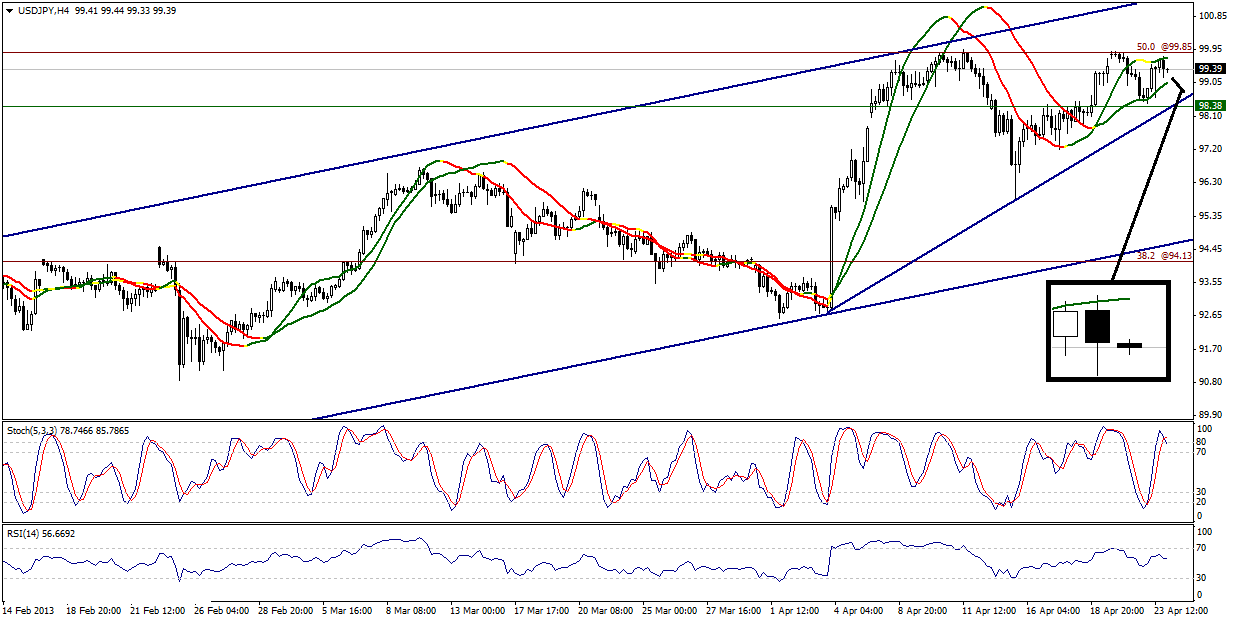 USD/JPY" title="USD/JPY" width="1233" height="619">
The pair is showing three negative signals that are stability below 99.85 levels and failing to breach it, the negative crossover shown on Stochastic and the bearish move taken by RSI; but Linear Regression Indicators tends to be positive. The previous four-hour candle shown on graph weakens the pair’s response to Linear Regression Indicators, which makes trading below 99.85 levels a reason for moving to the downside again. A four-hour closing above 99.85 levels cancels the possibility of bearishness today.
The trading range for today is among key support at 97.85 and key resistance at 100.85.
The general trend over short term basis is to the upside as far as areas of 84.00 remain intact targeting 100.00. USD/JPY_S&R" title="USD/JPY_S&R" width="639" height="133">
USD/CHF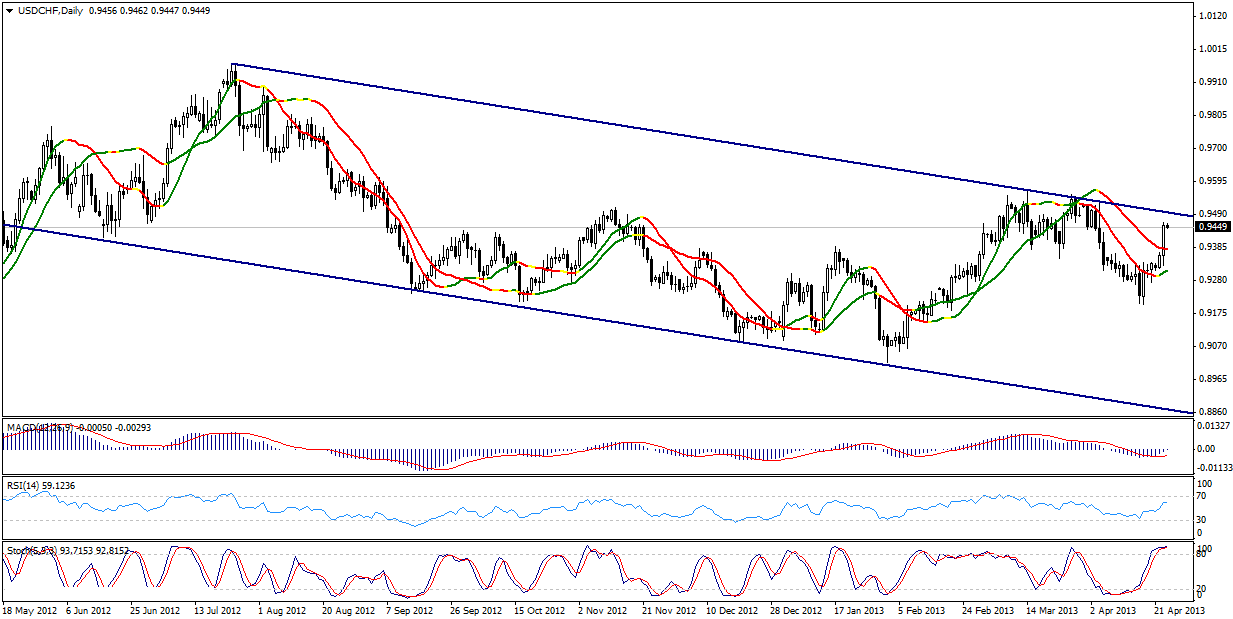 USD/CHF" title="USD/CHF" width="1233" height="619">
The pair moved to the upside as expected in our previous report as it got closer to key resistance level of the overall downside move starting from top at 0.9971. Stochastic is currently showing overbought signals and also the upside move of RSI is weakening. The referred to key resistance level resides at 0.9495 and we cannot confirm extending the upside move before breaching this level and stabilize above it. On the other hand, we don’t want to bet on a new bearish move today as there are no enough signals suggesting that to support momentum indicators signals. Therefore, we will remain intraday neutral in our European report.
The trading range for today is among key support at 0.9325 and key resistance at 0.9570.
The general trend over short term basis is to the downside stable at levels 0.9775 targeting 0.8860.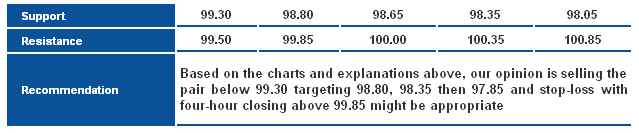 USD/JPY_S&R" title="USD/JPY_S&R" width="639" height="133">
USD/CAD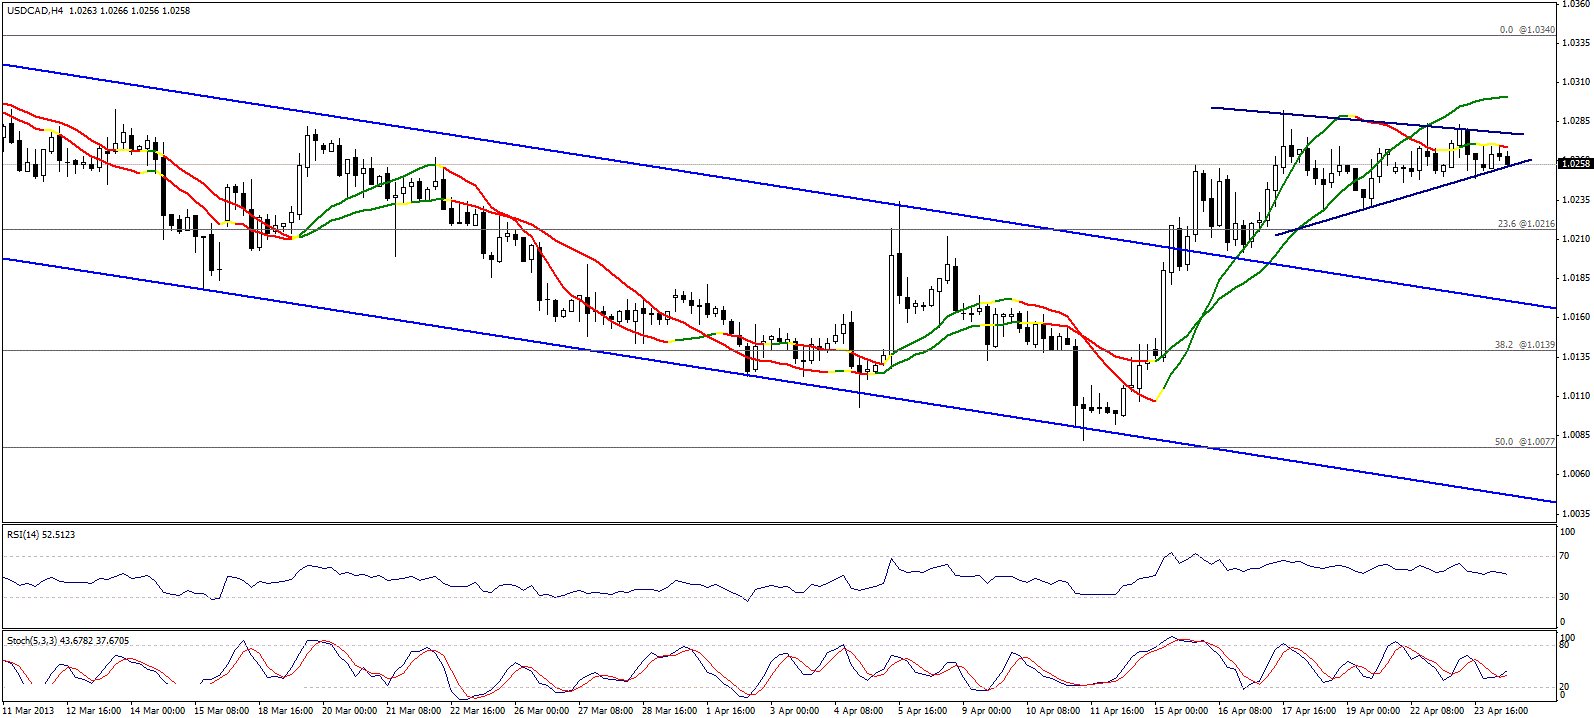 USD/CAD" title="USD/CAD" width="911" height="662">
The pair is still trading in narrow range that looks like the symmetrical triangle, this range appeared after breaching key resistance level of the downside move as shown on graph and it could be bullish continuous. Meanwhile, stability below Linear Regression Indicators and the negative bias of the RSI are what forces to be neutral intraday today waiting for confirmation signals.
The trading range for today is between the key support at 1.0185 and the key resistance at 1.0355.
The general trend over short term basis is to the upside with steady daily closing above levels 0.9800 targeting 1.0485.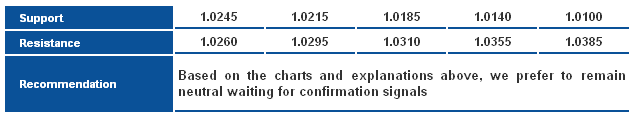 USD/CAD_S&R" title="USD/CAD_S&R" width="633" height="120">
AUD/USD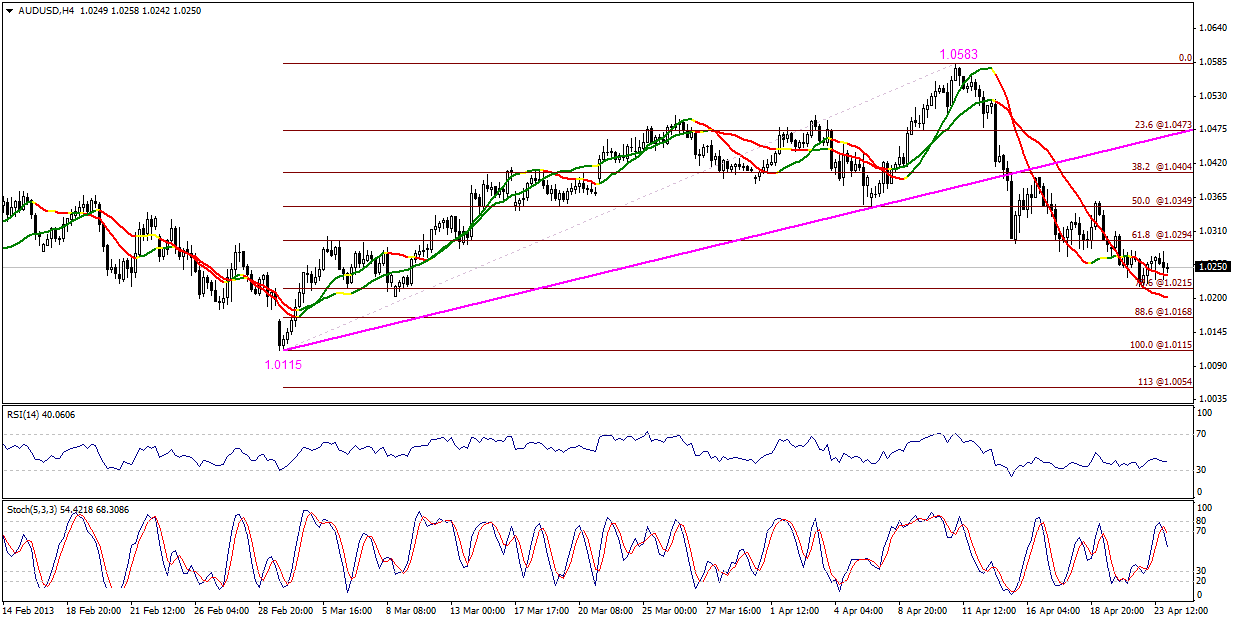 AUD/USD" title="AUD/USD" width="1233" height="619">
AUD/USD trading displayed an upside bias on Tuesday but remained below 1.0295. Linear Regression Indicators are still negative and Stochastic demonstrates a negative crossover however, in order for these adverse technical signals to be confirmed, a break to 1.0215 must take place. In general, trading between 1.0295 and 1.0215 compels us to stand aside.
- Trading range expected today is between the key support at 1.0115 and the key resistance 1.0355.
- Short-term trend is downside targeting 0.9400 if 1.0710 remains intact. USD/CAD_S&R" title="USD/CAD_S&R" width="633" height="120">
NZD/USD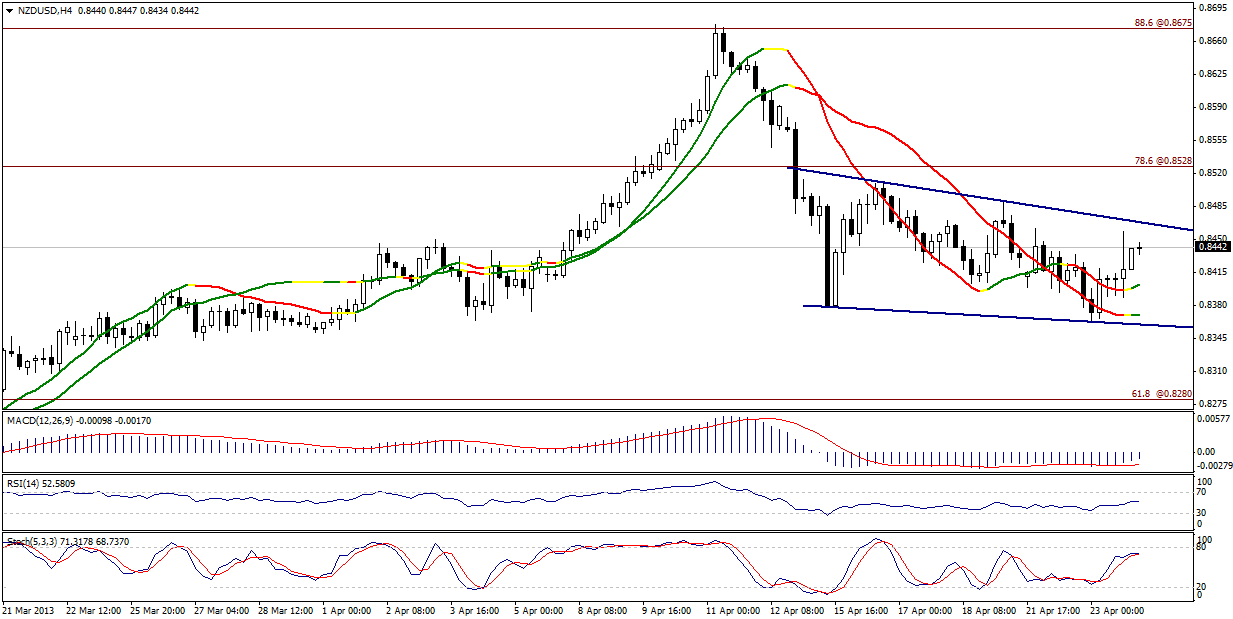 NZD/USD" title="NZD/USD" width="1233" height="619">
NZD/USD rose after failing to hold a position below 0.8380 however, the upside movement is limited in areas below the resistance at 0.8470. In these levels, we cannot confirm the return of the uptrend unless 0.8470 is breached, while Risk/Reward Ratio is currently inconvenient, provoking neutrality for today.
- Trading range expected today is between the key support at 0.8310 and the key resistance 0.8535.
- Short-term trend is upside targeting 0.8845 if 0.8130 remains intact.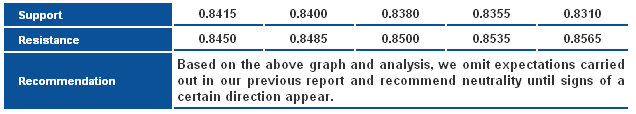 NZD/USD_S&R" title="NZD/USD_S&R" width="636" height="114">
GBP/JPY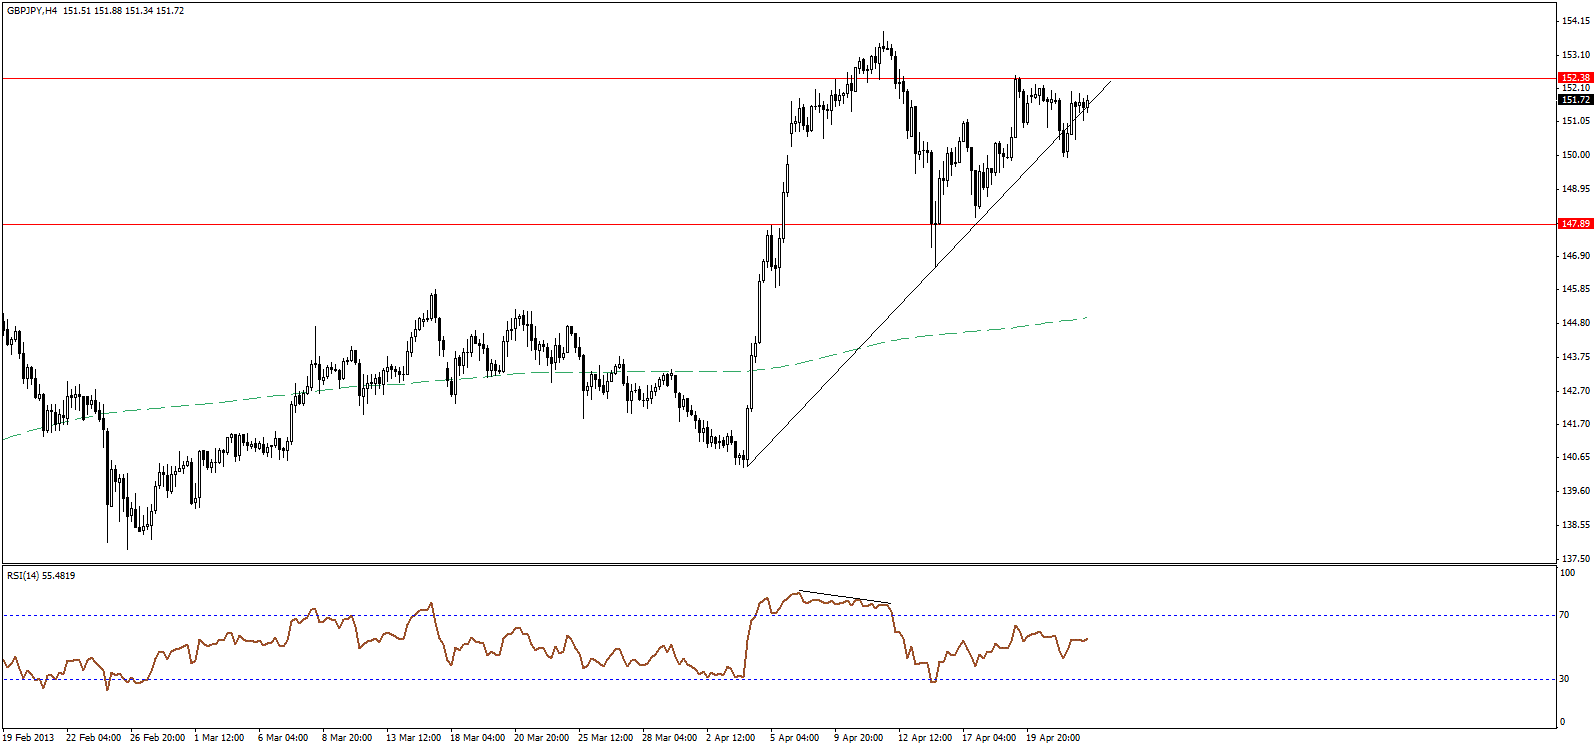 GBP/JPY" title="GBP/JPY" width="911" height="662">
After dipping sharply yesterday, the GBPJPY pair rebounded to settle back above the broken ascending support, and approaching 152.40 resistance level, trading back above the trend line threatens the bearish chances, while holding below 152.40 is necessary to keep any Bearish chances intact, as a break above it could signal a move towards the recent highs near 154.00.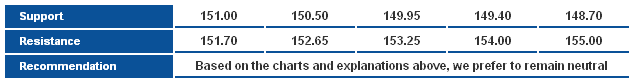 GBP/JPY_S&R" title="GBP/JPY_S&R" width="601" height="123">
EUR/JPY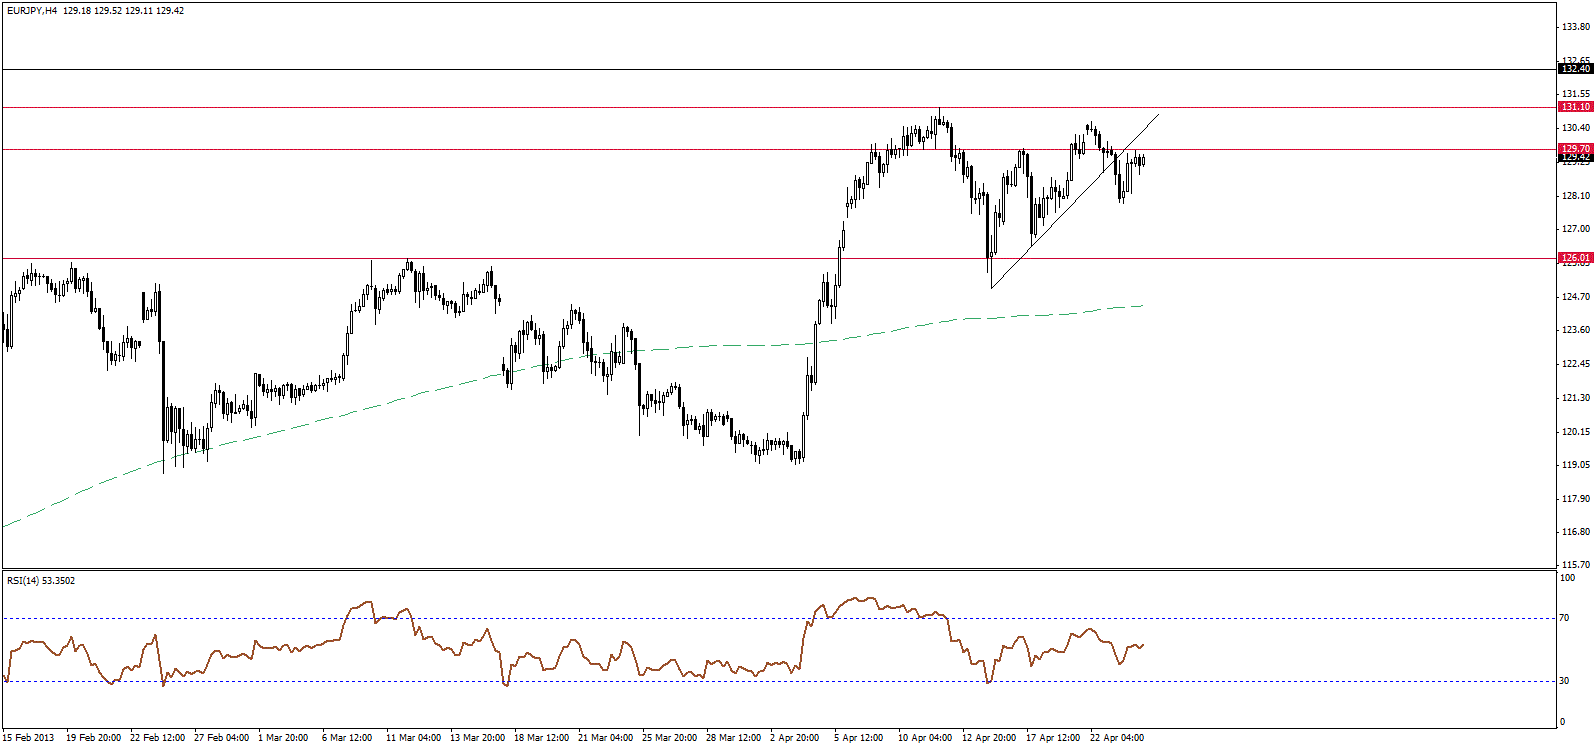 EUR/JPY" title="EUR/JPY" width="911" height="662">
After breaking below the minor ascending turned line shown on image, the EURJPY pair rebounded towards 129.70 resistance. Holding below the trend line and 129.70 keeps the bearish scenario possible, as price remains within a sideways range 131.00-126.00.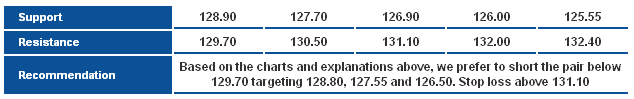 EUR/JPY_S&R" title="EUR/JPY_S&R" width="634" height="99">
EUR/GBP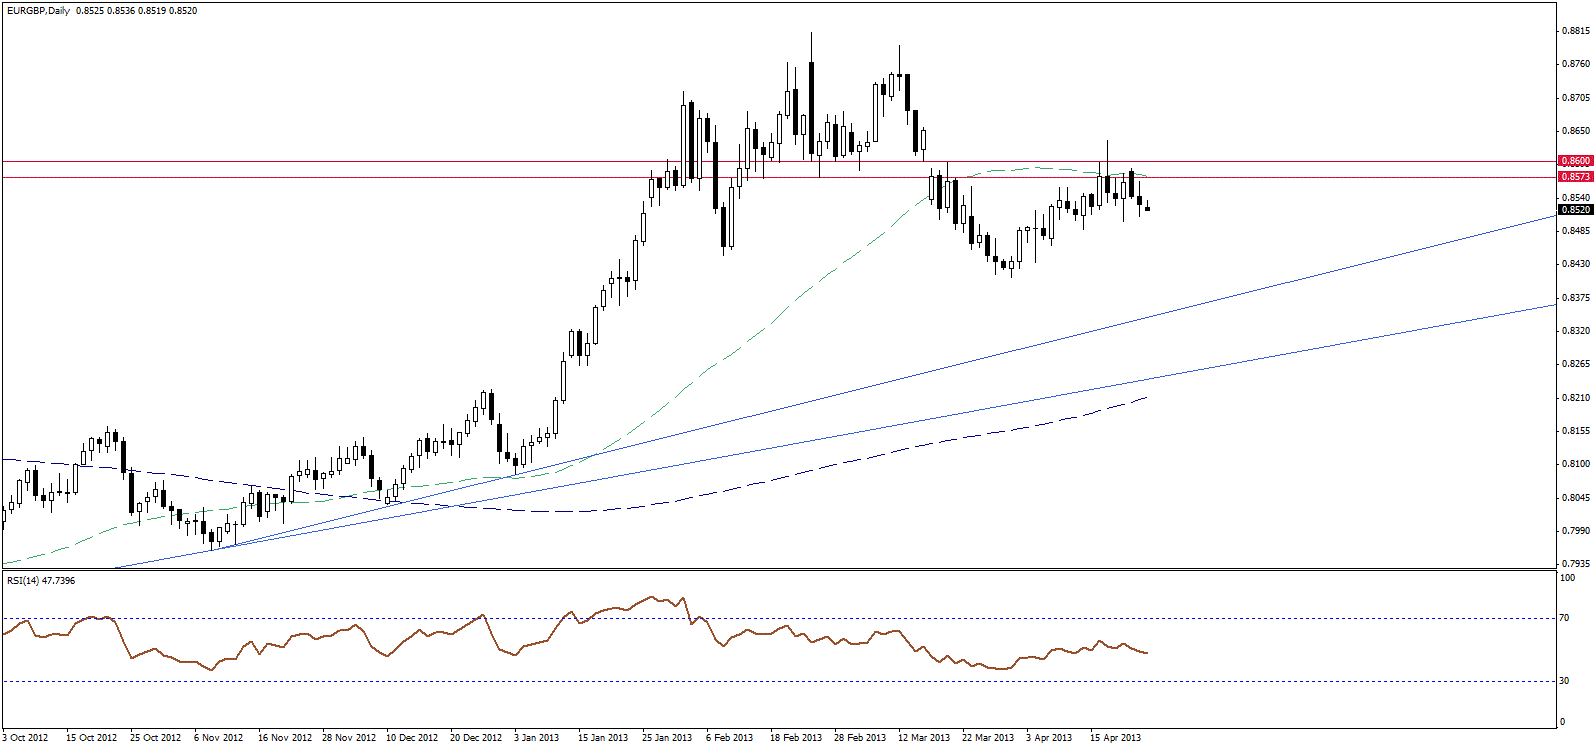 EUR/GBP" title="EUR/GBP" width="911" height="662">
The EURGBP pair ended yesterday’s session down, approaching 0.8500 support level, where we need to see a clear break below this level to confirm further downside, as it may be the catalyst for further sell-off. Overall, holding below the 50-days SMA and 0.8600 resistance keeps our bearish view intact.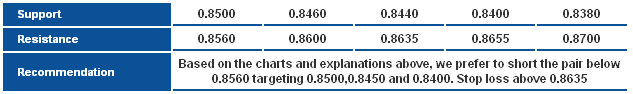 EUR/GBP_S&R" title="EUR/GBP_S&R" width="633" height="94">
- English (UK)
- English (India)
- English (Canada)
- English (Australia)
- English (South Africa)
- English (Philippines)
- English (Nigeria)
- Deutsch
- Español (España)
- Español (México)
- Français
- Italiano
- Nederlands
- Português (Portugal)
- Polski
- Português (Brasil)
- Русский
- Türkçe
- العربية
- Ελληνικά
- Svenska
- Suomi
- עברית
- 日本語
- 한국어
- 简体中文
- 繁體中文
- Bahasa Indonesia
- Bahasa Melayu
- ไทย
- Tiếng Việt
- हिंदी
Daily Technical Report Of Major Currencies: EUR/USD Drops Sharply
Published 04/24/2013, 05:49 AM
Updated 07/09/2023, 06:31 AM
Daily Technical Report Of Major Currencies: EUR/USD Drops Sharply
Latest comments
Loading next article…
Install Our App
Risk Disclosure: Trading in financial instruments and/or cryptocurrencies involves high risks including the risk of losing some, or all, of your investment amount, and may not be suitable for all investors. Prices of cryptocurrencies are extremely volatile and may be affected by external factors such as financial, regulatory or political events. Trading on margin increases the financial risks.
Before deciding to trade in financial instrument or cryptocurrencies you should be fully informed of the risks and costs associated with trading the financial markets, carefully consider your investment objectives, level of experience, and risk appetite, and seek professional advice where needed.
Fusion Media would like to remind you that the data contained in this website is not necessarily real-time nor accurate. The data and prices on the website are not necessarily provided by any market or exchange, but may be provided by market makers, and so prices may not be accurate and may differ from the actual price at any given market, meaning prices are indicative and not appropriate for trading purposes. Fusion Media and any provider of the data contained in this website will not accept liability for any loss or damage as a result of your trading, or your reliance on the information contained within this website.
It is prohibited to use, store, reproduce, display, modify, transmit or distribute the data contained in this website without the explicit prior written permission of Fusion Media and/or the data provider. All intellectual property rights are reserved by the providers and/or the exchange providing the data contained in this website.
Fusion Media may be compensated by the advertisers that appear on the website, based on your interaction with the advertisements or advertisers.
© 2007-2025 - Fusion Media Limited. All Rights Reserved.