
EUR/USD
 EUR/USD" title="EUR/USD" width="570" height="482">
The pair is trading below 1.3310 levels, and it’s possible to see a deeper downside correction, yet the general bullish move remains valid and didn’t confirm its end. Stochastic offers negative crossover supporting the possible negativity during today’s session. Breaching 1.3360 levels weakens the bearish correction.
The trading range for today is among the key support at 1.3165 and key resistance at 1.3480.
The general trend over the short-term is negative targeting 1.1865 as far as areas of 1.3550 remains intact. 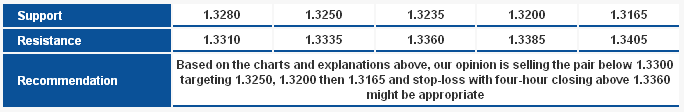 EUR/USD_S&R" title="EUR/USD_S&R" width="684" height="112">
GBP/USD GBP/USD" title="GBP/USD" width="570" height="482">
Momentum indicators and Linear Regression Indicators offer negative signals as shown on the graph in line with the pair's decline. But the pair is still stable above the upside key support levels and above 1.5994 levels, without breaking these levels we cannot confirm the extension of the downside move. Therefore, we remain neutral in the European session.
The trading range for today is among key support at 1.5910 and key resistance at 1.6215.
The general trend over the short-term basis is to the downside targeting 1.6875 as far as areas of 1.4225 remains intact. 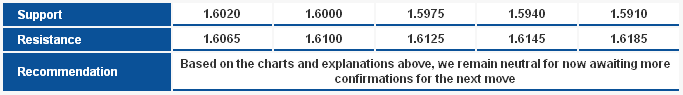 GBP/USD_S&R" title="GBP/USD_S&R" width="683" height="95">
USD/JPY USD/JPY" title="USD/JPY" width="570" height="482">
Breaking 88.20 levels shown on the graph has taken the pair out of the ascending channel, delaying the upside move and extending the downside correction. Linear Regression Indicators are negative and despite the oversold signals on Stochastic it did not offer any positive signal.
The trading range for today is among key support at 86.80 and key resistance at 90.10.
The general trend over the short-term is to the upside targeting 91.70 as far as areas of 83.40 remain intact.  GBP/USD_S&R" title="GBP/USD_S&R" width="683" height="95">
USD/CHF USD/CHF" title="USD/CHF" width="570" height="482">
The upside rush extended and the pair touched the first extended target of the bullish AB=CD harmonic Pattern. Looking at the graph above, we can suggest another harmonic formation that completes at the second target of the AB=CD harmonic formation at 0.9465 levels. Therefore, we think that there is a possibility to extend the upside move today.
The trading range for today is among key support at 0.9200 and key resistance at 0.9465.
The general trend over the short-term is to the downside stable at levels 0.9775 targeting 0.8860.  USD/CHF_S&R" title="USD/CHF_S&R" width="681" height="110">
USD/CAD USD/CAD" title="USD/CAD" width="570" height="482">
The pair is stable again above 88.6% correction shown on the graph after failing to break support levels at 0.9820 and 0.9800. Linear Regression Indicators are still negative but trading above the indicators will push the pair to the upside during today’s session. Areas of 0.9780 must hold for our positive expectations to prevail.
The trading range for today is between the key support at 0.9735 and the key resistance at 0.9965.
The general trend over the short-term is to the downside below levels 1.0125 targeting 0.9400. 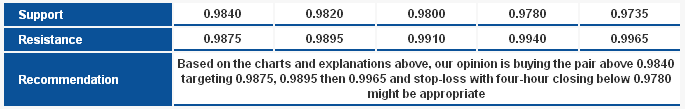 USD/CAD_S&R" title="USD/CAD_S&R" width="685" height="109">
AUD/USD AUD/USD" title="AUD/USD" width="570" height="482">
The pair is still trading within a very thin range but stable above 1.0535 levels most of the time, which makes us hold on to our positive expectations. Linear Regression Indicators are still positive and seemingly the sideways range is merely a correctional move; trading above 1.0490 levels will force us hold onto the bullish expectations.
The trading range for today is among key support at 1.0435 and key resistance at 1.0650.
The general trend over the short-term basis is to the downside below levels 1.0710 targeting 0.9400. 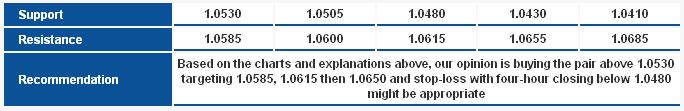 AUD/USD_S&R" title="AUD/USD_S&R" width="684" height="111">
NZD/USD NZD/USD" title="NZD/USD" width="570" height="482">
Trading mostly consolidated above Linear Regression Indicator 34 for more than a week; stability above this level makes the possibility of positivity remain valid. Trading above 0.8355 levels force us to hold on to our positive expectations taking into consideration the importance of breaching 0.8478 levels shown on the graph to support the extension of the upside move.
The trading range for today might be among key support at 0.8310 and key resistance at 0.8565.
The general trend over the short-term is to the upside with steady daily closing above 0.8130 targeting 0.8845. 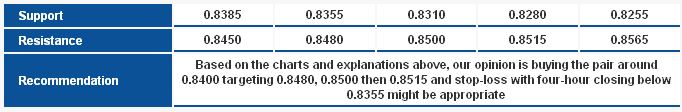 NZD/USD_S&R" title="NZD/USD_S&R" width="682" height="112">
Technical Crosses
GBP/JPY GBP/JPY" title="GBP/JPY" width="570" height="482">
Downtrend rolled on as expected in our previous report. Today, we consider trading below 142.60 reason for more negativity. The potential downtrend is seen as correction; the pair is still confined within an ascending channel, and current drop could push the pair to retest the main support of the channel.
The trading range expected for today is between the key support at 139.10 and the key resistance at 144.15.
The short-term trend is to the downside targeting 112.00 as far as 150.00 remains intact. 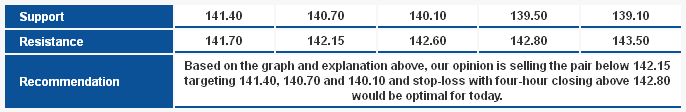 GBP/JPY_S&R" title="GBP/JPY_S&R" width="686" height="112">
EUR/JPY EUR/JPY" title="EUR/JPY" width="570" height="482">
Overall bullishness has not been cancelled, yet we opine chances for extending downside correction very likely throughout today's session. Linear Regression Indicator 34 has turned negative, Relative Strength Index also trades biased to the downside below 50 points, which projects negativity on momentum indicators as well. We could witness slight fluctuation because 50% correction at 116.85 is intact so far. All said, we cosnider trading below 118.60 cause of extra negativity.
The trading range for today is between the key support at 115.00 and the key resistance at 119.00.
The short-term trend is to the upside targeting 109.15 as far as 98.75 remains intact at week's closing. 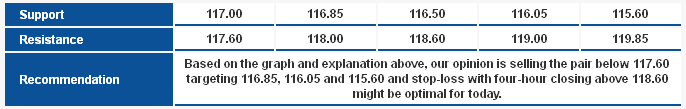 EUR/JPY_S&R" title="EUR/JPY_S&R" width="686" height="109">
EUR/GBP EUR/GBP" title="EUR/GBP" width="570" height="482">
The bearish candlestick confirmed yesterday suggests the pair is entering a downside correction for a short period of time, and any trading below the ascending channel's main resistance around 0.8330 boosts likelihood of a downside correction. However, note that breaching 0.8260 is vital to extending the correction. Stochastic shows a negative crossover in overbought areas, which supports the downside corrrection provided that the mentioned resistance holds ground.
The trading range expected for today is between the key support at 0.8165 and the key resistance 0.8420.
The short-term trend is to the upside targeting 1.0370 as far as 0.7785 remains intact. 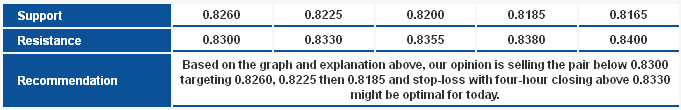 EUR/GBP_S&R" title="EUR/GBP_S&R" width="681" height="110">