
EUR/USD - European Session EUR/USD" width="1596" height="746">
The pair moved slightly to the upside yesterday and stabilized above the ascending key support supporting the possibility of extending positivity as long as the pair stabilizes above 1.2970. Despite negativity on Linear Regression Indicators, we will count on the bullish classical support shown on graph to suggest more positivity for today.
The trading range for today is among the key support at 1.2905 and key resistance at 1.3230.
The general trend over short term basis is to the upside targeting 1.3600 as far as areas of 1.2970 remains intact.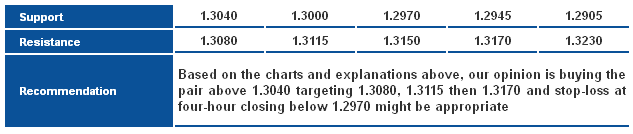 EUR/USD_S&R" width="633" height="134">
GBP/USD GBP/USD" width="1596" height="746">
The pair attempted to move to the upside yesterday but dropped today and is trading again close to the minor support 1.5200 and 1.5165 levels. Stability above the referred to level is negative and might trigger a new attempt to the upside. Despite negativity of Linear Regression Indicators and Stochastic, stability above 1.5165 represented in 78.6% correction shown on graph forces us to think that the pair might move again to the upside.
The trading range for today is among key support at 1.5090 and key resistance at 1.5380.
The general trend over short term basis is to the upside as far as areas of 1.5150 remains intact targeting 1.5975.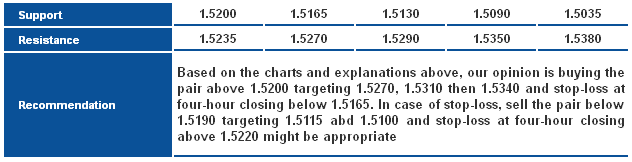 GBP/USD_S&R" width="632" height="162">
USD/JPY USD/JPY" width="1596" height="746">
The pair approached 61.8% correction level at 99.95 which is considered a significant interval for the pair today and the rest of the week. Stabilizing above 99.95 might extend bullishness supported by the positivity of Linear Regression Indicators and breakout of the descending channel earlier. We cannot bet on the upside move before stabilizing above the referred to level, to cancel overbought signals on RSI.
The trading range for today is among key support at 98.75 and key resistance at 101.60.
The general trend over short term basis is to the downside as far as areas of 103.50 remain intact targeting 93.50.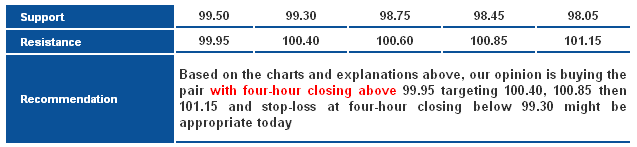 USD/JPY_S&R" width="637" height="147">
USD/CHF USD/CHF" width="1596" height="746">
The pair attempted to stabilize above 0.9485 yesterday represented in 50% correction of CD Leg of the Alternative harmonic Bat Pattern, but failed to trade below it. In fact, the technical harmonic analysis rules governs us now as stability above the first target represented in 38.2% correction at 0.9400 keeps the possibility of the overall upside move in order to move towards the second target at 0.9570 represented in 61.8% of the same mentioned leg.
The trading range for today is among key support at 0.9345 and key resistance at 0.9570.
The general trend over short term basis is to the downside stable at levels 0.9775 targeting 0.8860.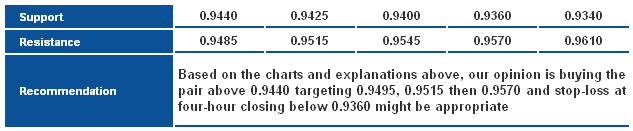 USD/CHF_S&R" width="633" height="131">
USD/CAD USD/CAD" width="1594" height="718">
Examining the four-hour graph, we find that the pair failed several times to stabilize above key resistance level of the upside move. Stability below 1.0530 with four-hour closing forces us to keep our negative expectations supported by the negative Linear Regression Indicator 34. If the pair stabilizes above 1.0530, the bearish correction might fail and a new strong upside move might occur.
The trading range for today is between the key support at 1.0355 and the key resistance at 1.0680.
The general trend over short term basis is to the upside with steady daily closing above levels 1.0100 targeting 1.0775.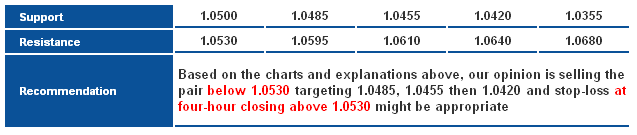 USD/CAD_S&R" width="637" height="135">
AUD/USD AUD/USD" width="1596" height="746">
The AUDUSD pair touched levels above our first target at 0.9225, however retreated sharply during the Asian session, we consider this retreat as a new opportunity to long the pair at a good price, and as long as the previous low around 0.9110 is holding. Therefore, we maintain our intraday bullish scenario.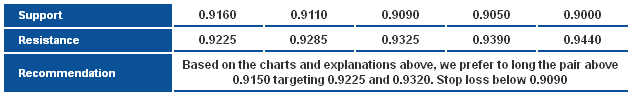 AUD/USD_S&R" width="639" height="99">
NZD/USD NZD/USD" width="1596" height="746">
The NZDUSD pair pushed strongly higher yesterday, but failed at 0.7835 resistance level, a break above this resistance is our condition for the bullish reversal scenario, and thus we will continue to wait for a clear break above this resistance to suggest a move higher. 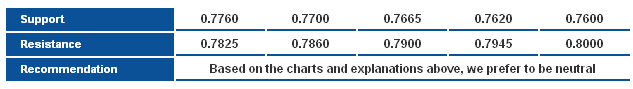 NZD/USD_S&R" width="633" height="89">
GBP/JPY GBP/JPY" width="1596" height="762">
The GBP/JPY pair is attempting to breach the solid resistance barrier at 151.90 as we expect the continuation of the uptrend, based on the bullish channel above. Expected targets begin at 151.90 and the pair has to reside above 148.95 to confirm our expectation.
**Trading range expected today is between the key support at 150.00 and the key resistance 153.15.
**Short-term trend is upside targeting 163.00 if 147.65 remains intact.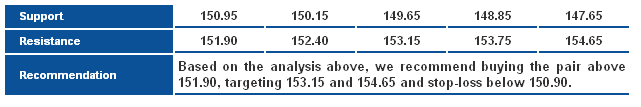 GBP/JPY_S&R" width="641" height="107">
EUR/JPY EUR/JPY" width="1596" height="762">
The EUR/JPY pair breached 129.90 with a daily closing above, bolstering forecasts of the continuation of the uptrend over the upcoming intraday and short-term basis. The pair now aims at 131.35 as target to clear the path toward more bullish targets. Breaking 128.45 will foil our positive forecast.
**Trading range expected today is between the main support at 129.00 and the main resistance at 132.15.
**Short-term trend is upside, targeting 140.00 if 124.95 remains intact.
EUR/GBP EUR/GBP_S&R" width="1596" height="746">
The EURGBP pair has tentatively broken the main deseeding resistance shown on chart, and that is not enough to suggest the continuation of the move higher, although our bias remains to the upside, we would like to see further stability above 0.8600 level to confirm it. 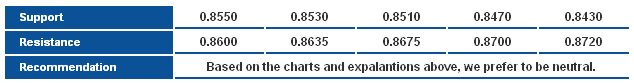 EUR/GBP_S&R" width="634" height="83">
- English (UK)
- English (India)
- English (Canada)
- English (Australia)
- English (South Africa)
- English (Philippines)
- English (Nigeria)
- Deutsch
- Español (España)
- Español (México)
- Français
- Italiano
- Nederlands
- Português (Portugal)
- Polski
- Português (Brasil)
- Русский
- Türkçe
- العربية
- Ελληνικά
- Svenska
- Suomi
- עברית
- 日本語
- 한국어
- 简体中文
- 繁體中文
- Bahasa Indonesia
- Bahasa Melayu
- ไทย
- Tiếng Việt
- हिंदी
Daily Technical Report : July 02, 2013
Published 07/02/2013, 06:48 AM
Updated 07/09/2023, 06:31 AM
Daily Technical Report : July 02, 2013
Latest comments
Loading next article…
Install Our App
Risk Disclosure: Trading in financial instruments and/or cryptocurrencies involves high risks including the risk of losing some, or all, of your investment amount, and may not be suitable for all investors. Prices of cryptocurrencies are extremely volatile and may be affected by external factors such as financial, regulatory or political events. Trading on margin increases the financial risks.
Before deciding to trade in financial instrument or cryptocurrencies you should be fully informed of the risks and costs associated with trading the financial markets, carefully consider your investment objectives, level of experience, and risk appetite, and seek professional advice where needed.
Fusion Media would like to remind you that the data contained in this website is not necessarily real-time nor accurate. The data and prices on the website are not necessarily provided by any market or exchange, but may be provided by market makers, and so prices may not be accurate and may differ from the actual price at any given market, meaning prices are indicative and not appropriate for trading purposes. Fusion Media and any provider of the data contained in this website will not accept liability for any loss or damage as a result of your trading, or your reliance on the information contained within this website.
It is prohibited to use, store, reproduce, display, modify, transmit or distribute the data contained in this website without the explicit prior written permission of Fusion Media and/or the data provider. All intellectual property rights are reserved by the providers and/or the exchange providing the data contained in this website.
Fusion Media may be compensated by the advertisers that appear on the website, based on your interaction with the advertisements or advertisers.
© 2007-2025 - Fusion Media Limited. All Rights Reserved.