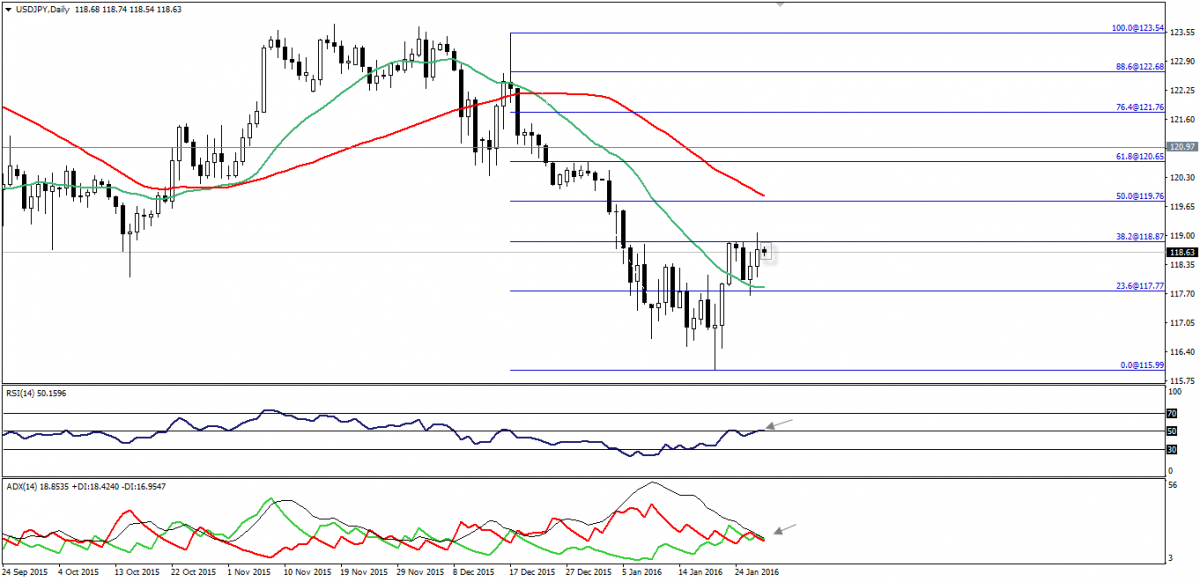
The USD/JPY has formed an upper shadow above 118.85 –Fibonacci of 38.2%- and closed below it, while trading stabilized below this important level during the Asian session.

Trading below 118.85 without achieving a 4-hour closing doesn’t support bulls, while 118.30 offers support from the downside; noting that, RSI and ADX don’t present reliable signals.
Hence, we will avoid trading the pair now until it presents reasonable risk versus reward ratio.
Support: 118.30-117.75-117.30
Resistance: 118.85-119.10-119.50
Direction: Neutral
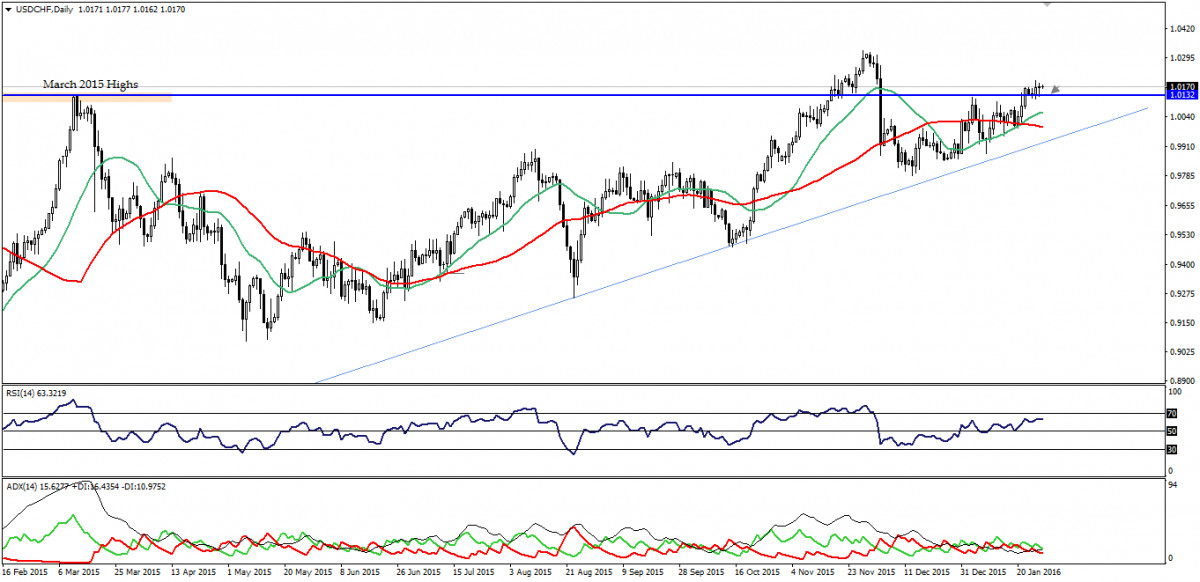
USD/CHF has been traded within the same range during the Asian session, while the fall seen after FOMC statement yesterday didn’t continue after finding support above 1.0130 as seen on the provided daily chart.

RSI moves in a neutral mode, while ADX reflects the uncertainty about upcoming big move.
So then, we will watch out the price behaviors, but we will use sell stop order types below the aforesaid level.
Support: 1.0130-1.0110-1.0065
Resistance: 1.0180-1.0220-1.0250
Direction: Sideways, but bearish below 1.0130
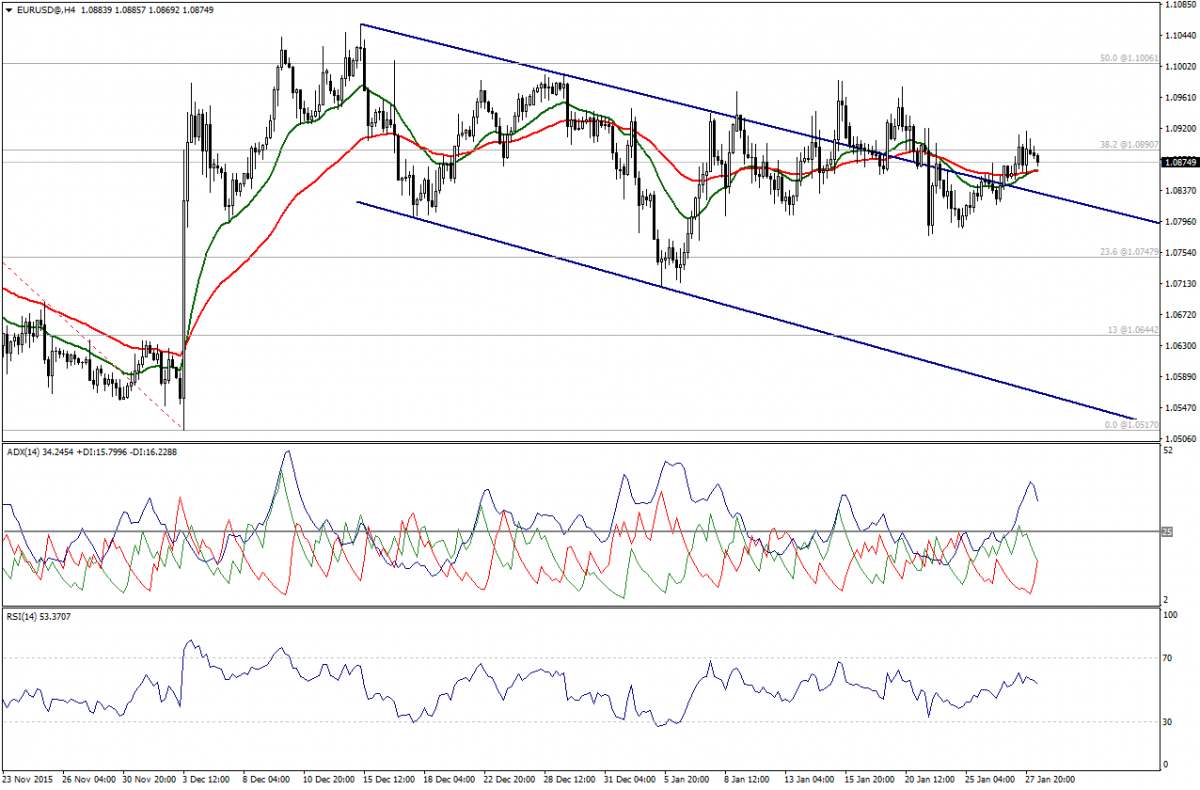
Although EUR traded above the resistance line and above the support of 1.0835 along with stable moves above moving averages at 1.0860, it failed to stabilize above 38.2% Fibonacci at 1.0890.

ADX attempts to be bearish, while RSI shows decease in momentum despite moving above 50.00.
All those technical signs force us to remain on the sidelines now.
Support: 1.0835– 1.0790 – 1.0745
Resistance: 1.0890 –1.0935 – 1.0985
Direction: Bullish
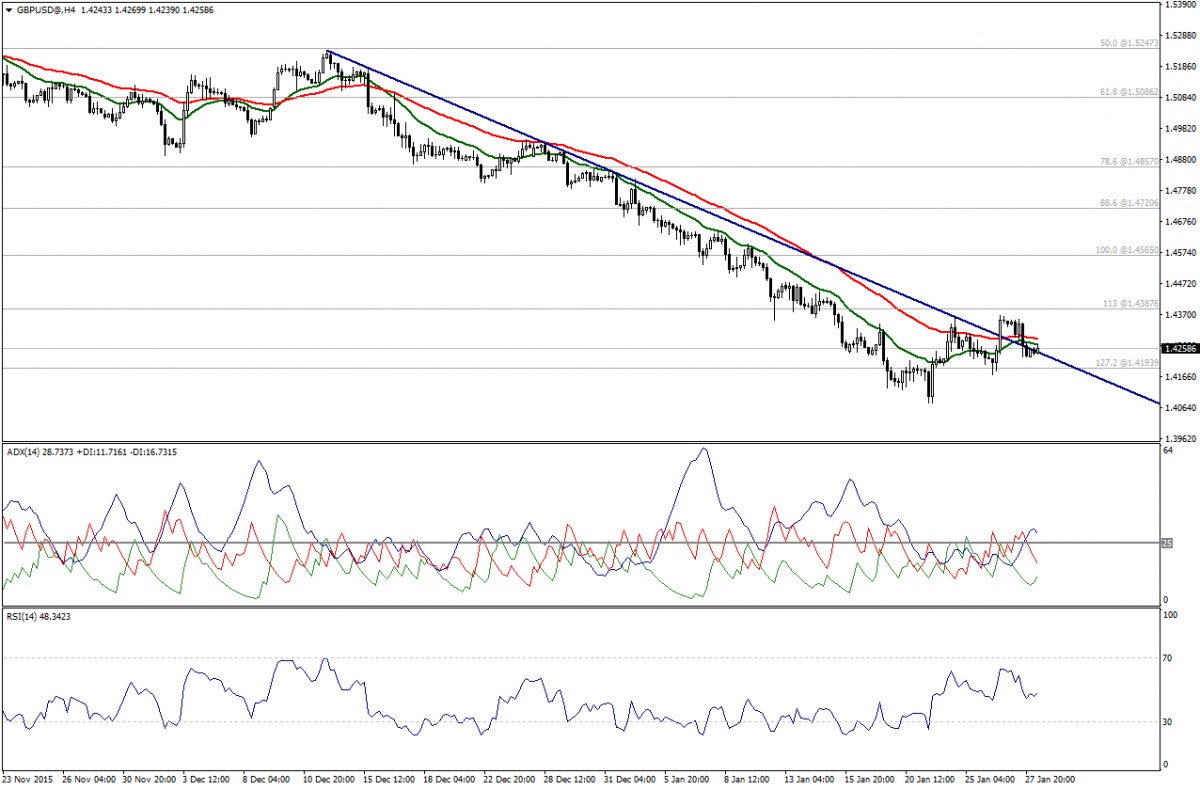
GBP/USD hovers around the resistance seen on the chart below moving averages 20 and 50 at 1.4295, which represent a strong resistance.

On the downside, the pair stabilizes above 1.4190 along with negative signals on trend indicators without affirming the upside recovery.
RSI moves below 50.00 in a sideways range and thus, we will be neutral until a reasonable signal appears.
Support: 1.4230 – 1.4190 – 1.4100
Resistance: 1.4290 – 1.4325 – 1.4390
Direction: Neutral
