Topic: Global macro - stocks, commodities, currencies & bonds

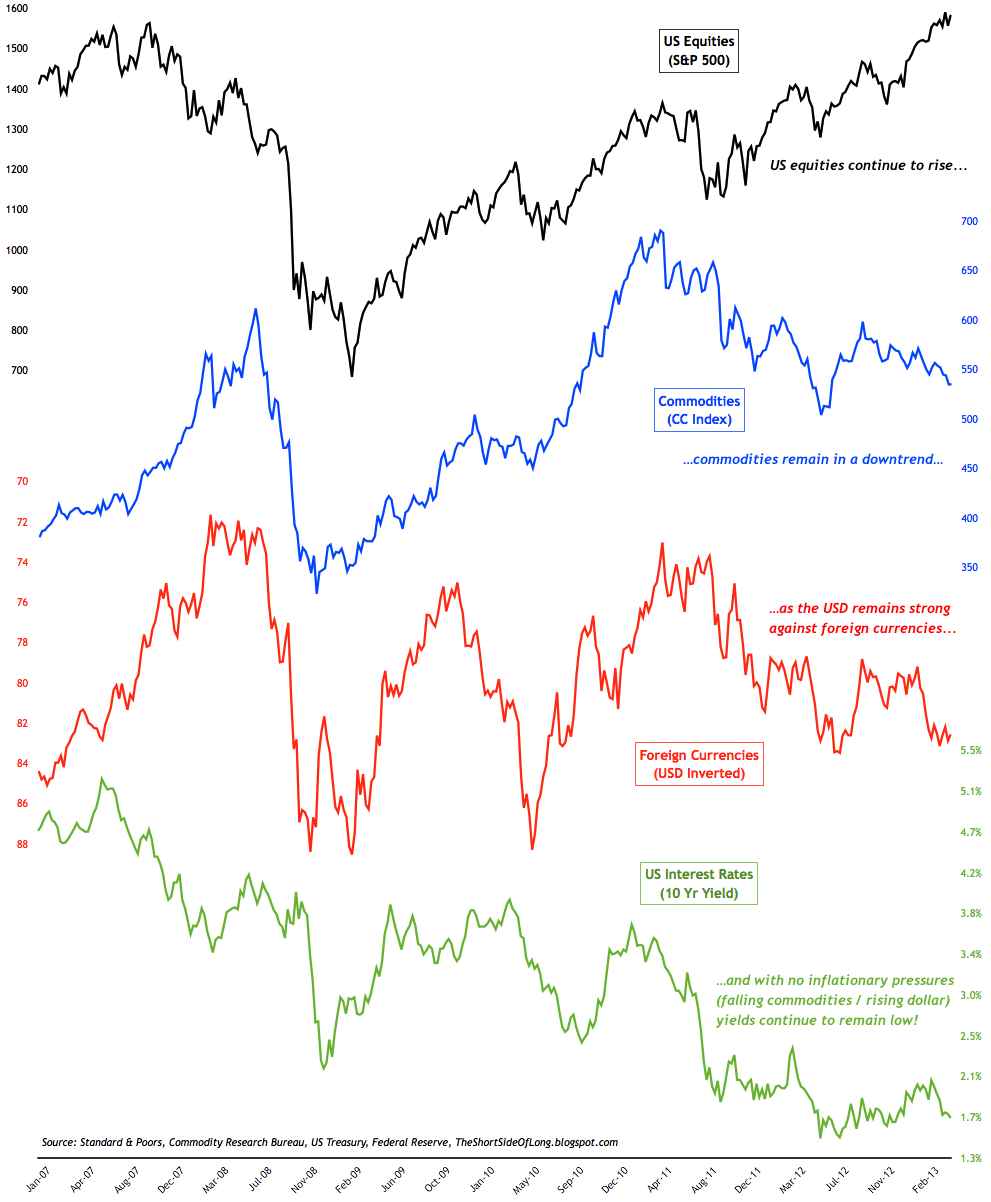
Once in a while I like to post a chart of the overall Global Macro trade, where I follow the S&P 500, Continuous Commodity Index, inverted US Dollar Index and the US Treasury 10 Year Note yield. Essentially, it is a summary price grid of four major asset classes. Here are a few interesting observations:
[updated...]
Topic: Overbought and oversold levels of major assets

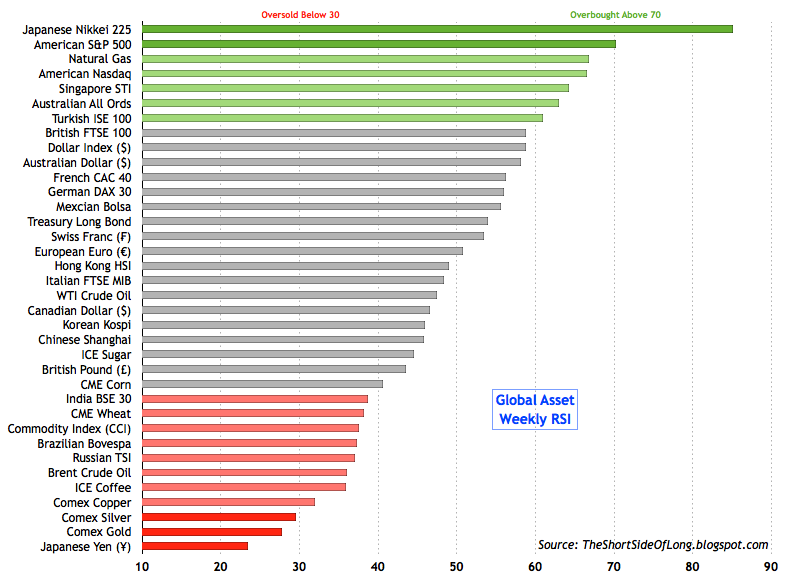
Weekly RSI levels are sometimes a very useful indicator to look at on a relative basis against other assets. It is mainly equities that dominate the overbought levels, with US and Japanese equities (large money printing CB programs) showing the best performance and also most overbought readings. Understandably, the Japanese yen is all the way on the opposite side of the Nikkei's readings. The only commodity doing well in recent months has been Natural Gas, with the majority of other commodities oversold (especially PMs). Copper, Gold and Silver have been beaten down in recent weeks and remain oversold. Commodity producers like Brazil and Russia also have struggling equity markets.
Topic: Gold in the midst of the worst performance since 2008

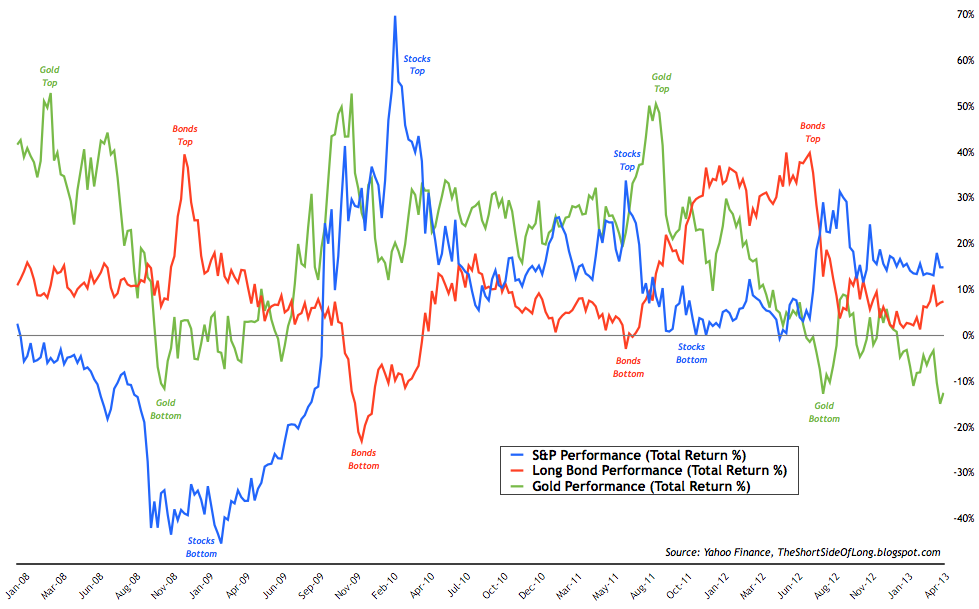
The US equities now remain in a fifth year annual gain streak, not posting a losing calendar year since 2008. Furthermore, US equities have not experienced a 12 month rolling decline in performance for the last four and half years either. Quite an achievement. Such bullish performance has retail investors lining up at the door (equity fund flows were huge last quarter). They must be "extrapolating" the last four years of gains and anticipating good times ahead.
On the other hand, Gold has been one of the major under-performers in recent months. While we saw an intermediate bottom in Gold price around August 2012, the price has yet again disappointed towards lower lows. As prices reached $1,320 during the recent sell off, Gold's annual performance dropped as low as 20% - more oversold than during the 2008 panic.
[updated...]
Topic: Bloomberg analysis points towards Gold at $800 / ounce
How do we summarise the recent performance of two major asset classes in recent negative correlation (Stocks vs Gold). The majority of investors are comfortable being bullish on stocks and continue with their Gold bashing. On the other hand, contrarian investors like Marc Faber express their opinion on the matter:
"...before selling my precious metals and buying US equities I would consider the following. In the last great bull market for gold (1970 – 1980), US equities outperformed gold by a factor of 3 between December 1974 and August 1976. However, gold subsequently massively outperformed equities since the gold price rose by another 8-time between the December 1974 low and the January 1980 high whereas equities moved largely sideward.
I need to point out that in December 1974 stocks were extremely depressed (the dividend yield of the Dow Jones was more than 6%) having declined by 46% from the 1973 high. On the other hand, in September 2011, stock had already rallied from the March 2009 low by 60% (the dividend yield of the Dow less than 3%).
Lastly, I have seldom read so many negative reports about any asset class as I currently have read about precious metals. Brokers, banks, and strategists alike - all seem to suddenly know that gold and silver will decline further."
Below you may find the video.

Once in a while I like to post a chart of the overall Global Macro trade, where I follow the S&P 500, Continuous Commodity Index, inverted US Dollar Index and the US Treasury 10 Year Note yield. Essentially, it is a summary price grid of four major asset classes. Here are a few interesting observations:
- US equities (as well as Japanese equities) have decoupled from the so called "Risk On" trade and have been rising almost vertically, despite global issues. In recent weeks, the majority of technical indicators and sentiment surveys point to overbought levels and high optimism.
- Commodities and foreign currencies remain in a downtrend, but importantly, have not made a lower low (yet). Sentiment is extremely negative on these two sectors of the market, while technicals in certain commodities and currencies are very oversold.
- Due to the rising Dollar and a downtrend in commodity prices, inflation expectations have once again fallen. This is not putting any pressure on bond yields, which remain low. Interestingly, just like with commodities and foreign currencies, yields have also not made a lower low.
[updated...]
Topic: Overbought and oversold levels of major assets

Weekly RSI levels are sometimes a very useful indicator to look at on a relative basis against other assets. It is mainly equities that dominate the overbought levels, with US and Japanese equities (large money printing CB programs) showing the best performance and also most overbought readings. Understandably, the Japanese yen is all the way on the opposite side of the Nikkei's readings. The only commodity doing well in recent months has been Natural Gas, with the majority of other commodities oversold (especially PMs). Copper, Gold and Silver have been beaten down in recent weeks and remain oversold. Commodity producers like Brazil and Russia also have struggling equity markets.
Topic: Gold in the midst of the worst performance since 2008

The US equities now remain in a fifth year annual gain streak, not posting a losing calendar year since 2008. Furthermore, US equities have not experienced a 12 month rolling decline in performance for the last four and half years either. Quite an achievement. Such bullish performance has retail investors lining up at the door (equity fund flows were huge last quarter). They must be "extrapolating" the last four years of gains and anticipating good times ahead.
On the other hand, Gold has been one of the major under-performers in recent months. While we saw an intermediate bottom in Gold price around August 2012, the price has yet again disappointed towards lower lows. As prices reached $1,320 during the recent sell off, Gold's annual performance dropped as low as 20% - more oversold than during the 2008 panic.
[updated...]
Topic: Bloomberg analysis points towards Gold at $800 / ounce
How do we summarise the recent performance of two major asset classes in recent negative correlation (Stocks vs Gold). The majority of investors are comfortable being bullish on stocks and continue with their Gold bashing. On the other hand, contrarian investors like Marc Faber express their opinion on the matter:
"...before selling my precious metals and buying US equities I would consider the following. In the last great bull market for gold (1970 – 1980), US equities outperformed gold by a factor of 3 between December 1974 and August 1976. However, gold subsequently massively outperformed equities since the gold price rose by another 8-time between the December 1974 low and the January 1980 high whereas equities moved largely sideward.
I need to point out that in December 1974 stocks were extremely depressed (the dividend yield of the Dow Jones was more than 6%) having declined by 46% from the 1973 high. On the other hand, in September 2011, stock had already rallied from the March 2009 low by 60% (the dividend yield of the Dow less than 3%).
Lastly, I have seldom read so many negative reports about any asset class as I currently have read about precious metals. Brokers, banks, and strategists alike - all seem to suddenly know that gold and silver will decline further."
Below you may find the video.
