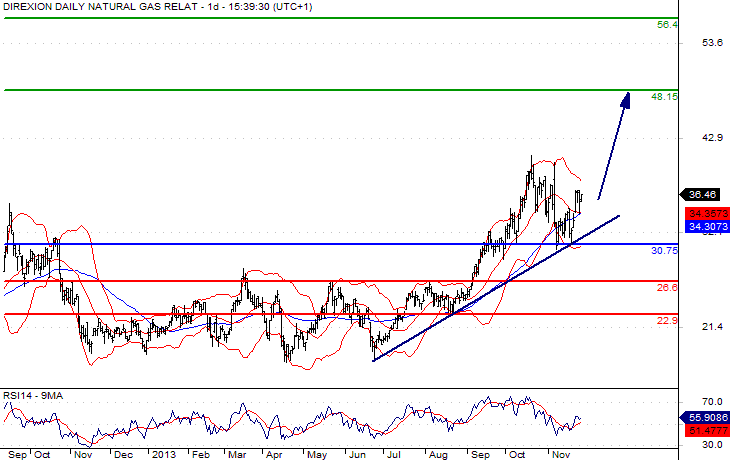
From a technical view, the ETF is supported by a bullish trend line in progress since June 2013.
Regarding technical indicators, the 50-day simple moving average is rising and provides support around $34.30. The daily RSI is above its neutrality area. A further upside is expected.
On a relative basis against the S&P500, the Direxion Daily Natural Gas Related Bull 3x Shares is just above the 50 day moving average and looks set for a rebound.
Trading strategy:
Buy at $36.46 - Stop loss at $30.75 - Target at $48.15
