Wall Street indices extended recent losses yesterday with a lack of new developments in the U.S.-China trade negotiations raising fears of a global slowdown. Oil prices collapsed as a result.
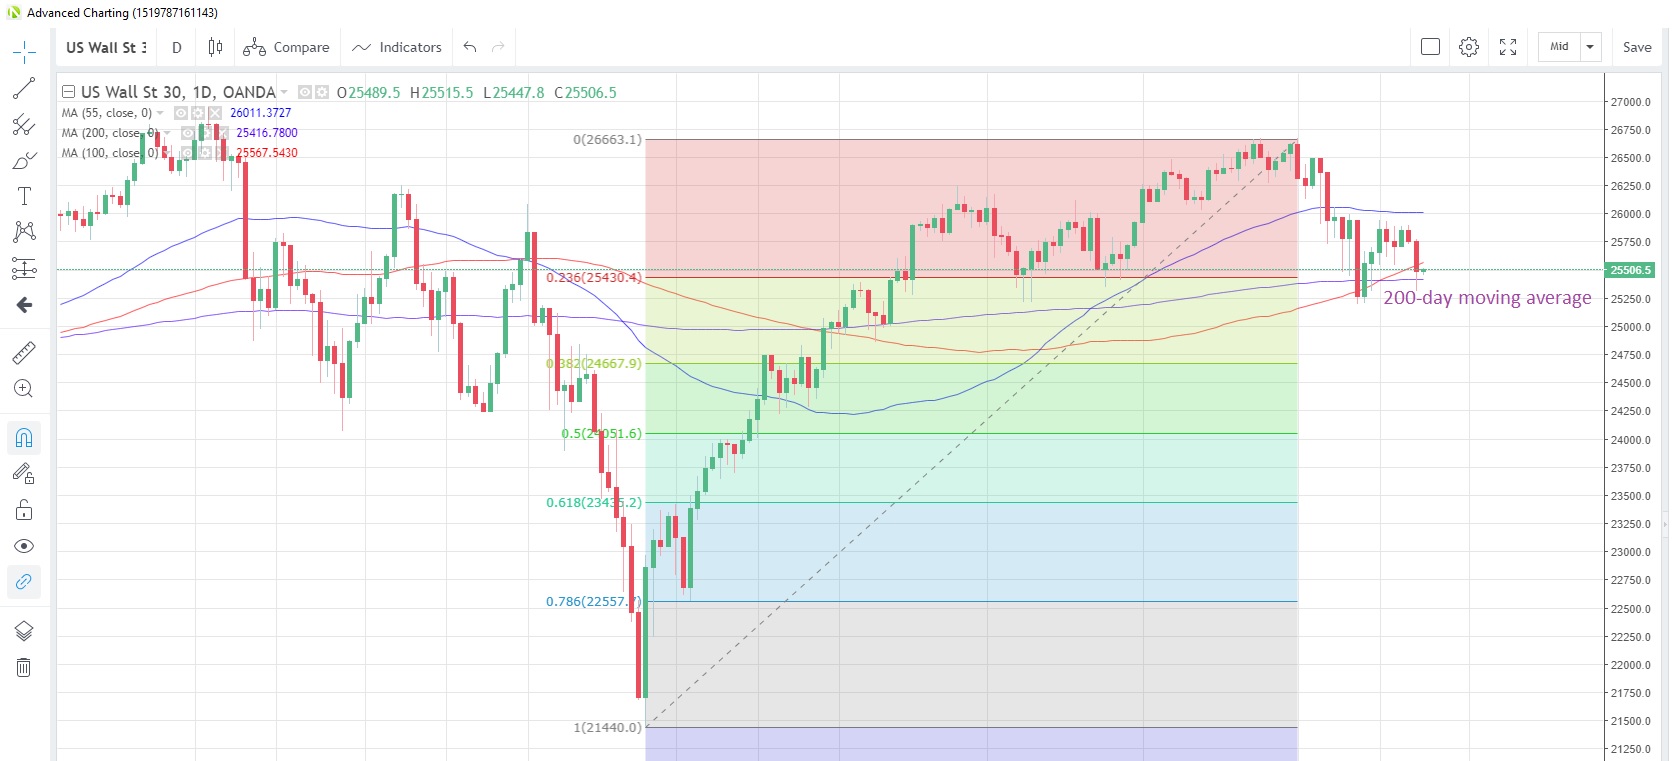
US30USD Daily Chart
Source: OANDA fxTrade
- The US30 index fell the most in 10 days yesterday with trade war troubles dominating sentiment. Energy stocks came under pressure as oil prices tumbled
- The index closed below the 100-day moving average at 25,539 for the first time in 10 days. The 200-day moving average is at 25,416 today
- U.S. durable goods orders are expected to fall 2.0% in April following a 2.8% increase in March.
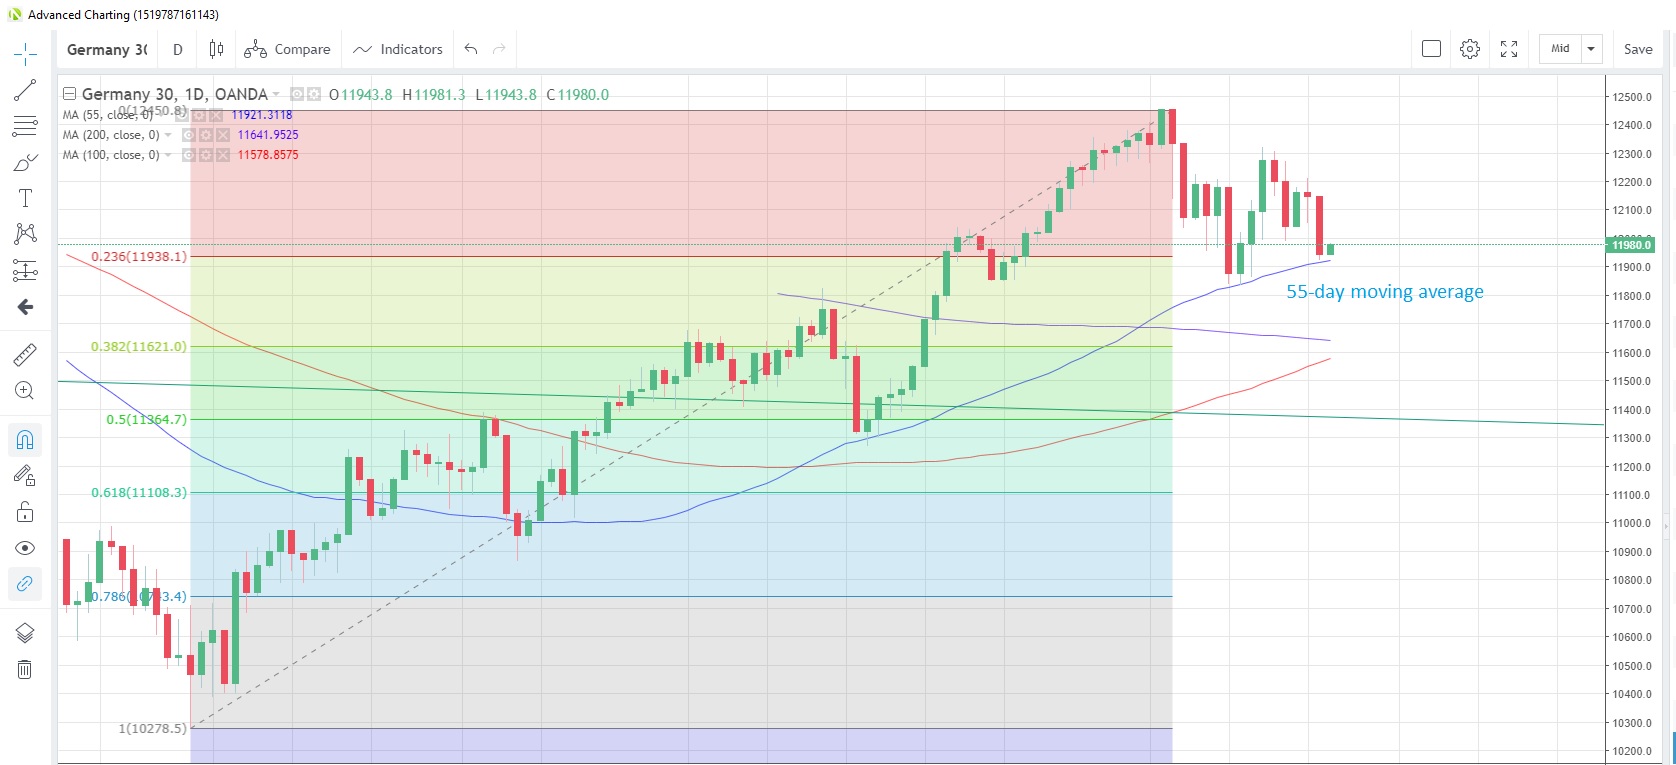
DE30EUR Daily Chart
Source: OANDA fxTrade
- The Germany30 index had its worst down day since May 13 yesterday following some data misses for both Germany and the Euro-zone. Weakness on Wall Street didn’t help either
- Support at the 55-day moving average at 11,921 remains intact and has supported prices on a closing basis since February 8
- The Markit manufacturing PMI reading for Germany for May fell to 44.3, a three-month low, while the Euro-zone reading fell to 47.7. Both were below economists’ estimates. There are no data releases scheduled for today.
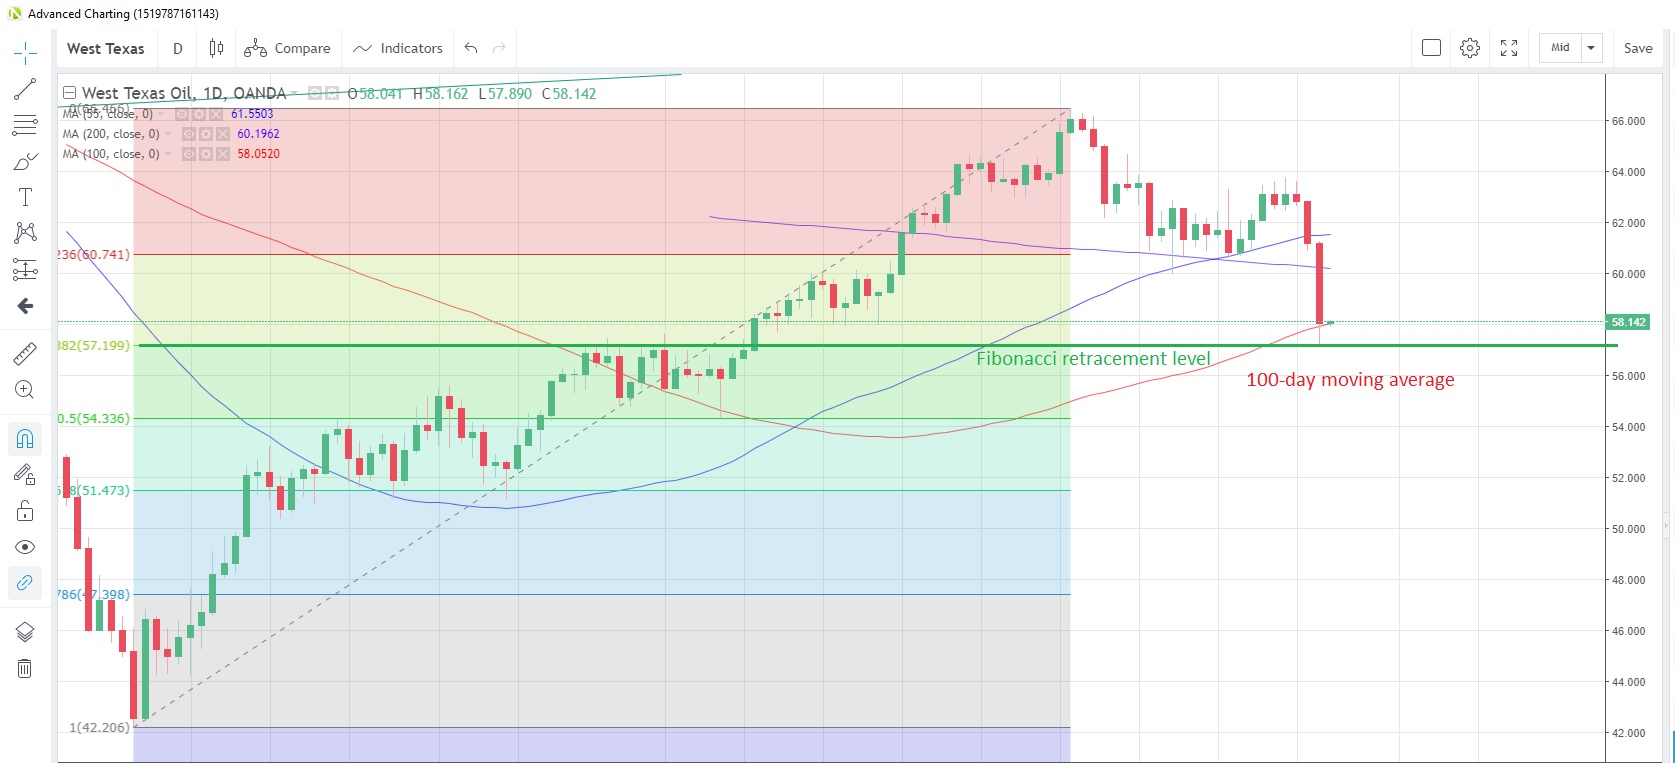
WTICOUSD Daily Chart
Source: OANDA fxTrade
- WTI prices fell the most in six months yesterday as the ongoing U.S.-China trade conflict raised questions about global economic growth in the future
- Prices fell to the lowest in 10 weeks, testing the 100-day moving average at 67.938 for the first time since March 8. Fibonacci support may be found at the 57.20 level
- Weak PMI readings across Europe added to the negative sentiment for global oil demand. An easing in U.S.-Iran tensions also eased supply concerns.


