U.S. indices extended recent declines, as uncertainty surrounding today’s tariff deadline took hold. Will Trump pull the trigger and raise tariffs from 10% to 25% on Chinese goods? China shares have suffered more than Wall Street under the threat.
US30/USD Daily Chart
Source: OANDA fxTrade
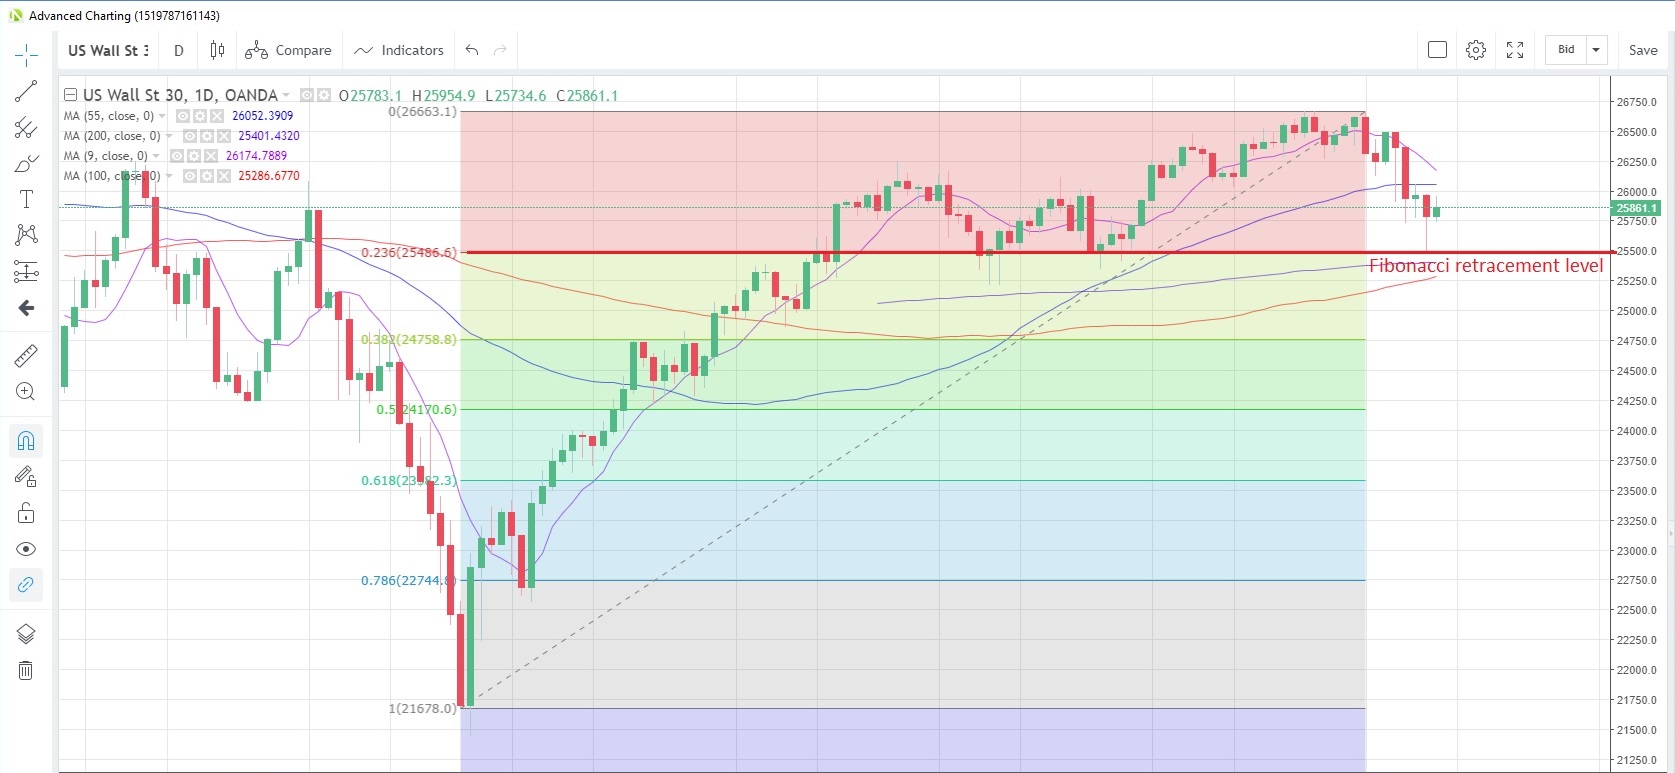
- The US30 index fell to the lowest level since March 27 as a lack of news on the trade negotiation front exacerbated weakness from the tariff deadline
- The decline stalled at the 23.6% Fibonacci retracement of the December-May rally at 25,486. The index rebounded into the close but still ended in the red
- US consumer prices probably rose at a marginally faster pace of 2.1% y/y in April, from +1.9% in March. Speeches from Fed’s Brainard and Bostic are scheduled, but will no doubt be overshadowed by developments after the tariff deadline.
DE30/EUR Daily Chart
Source: OANDA fxTrade
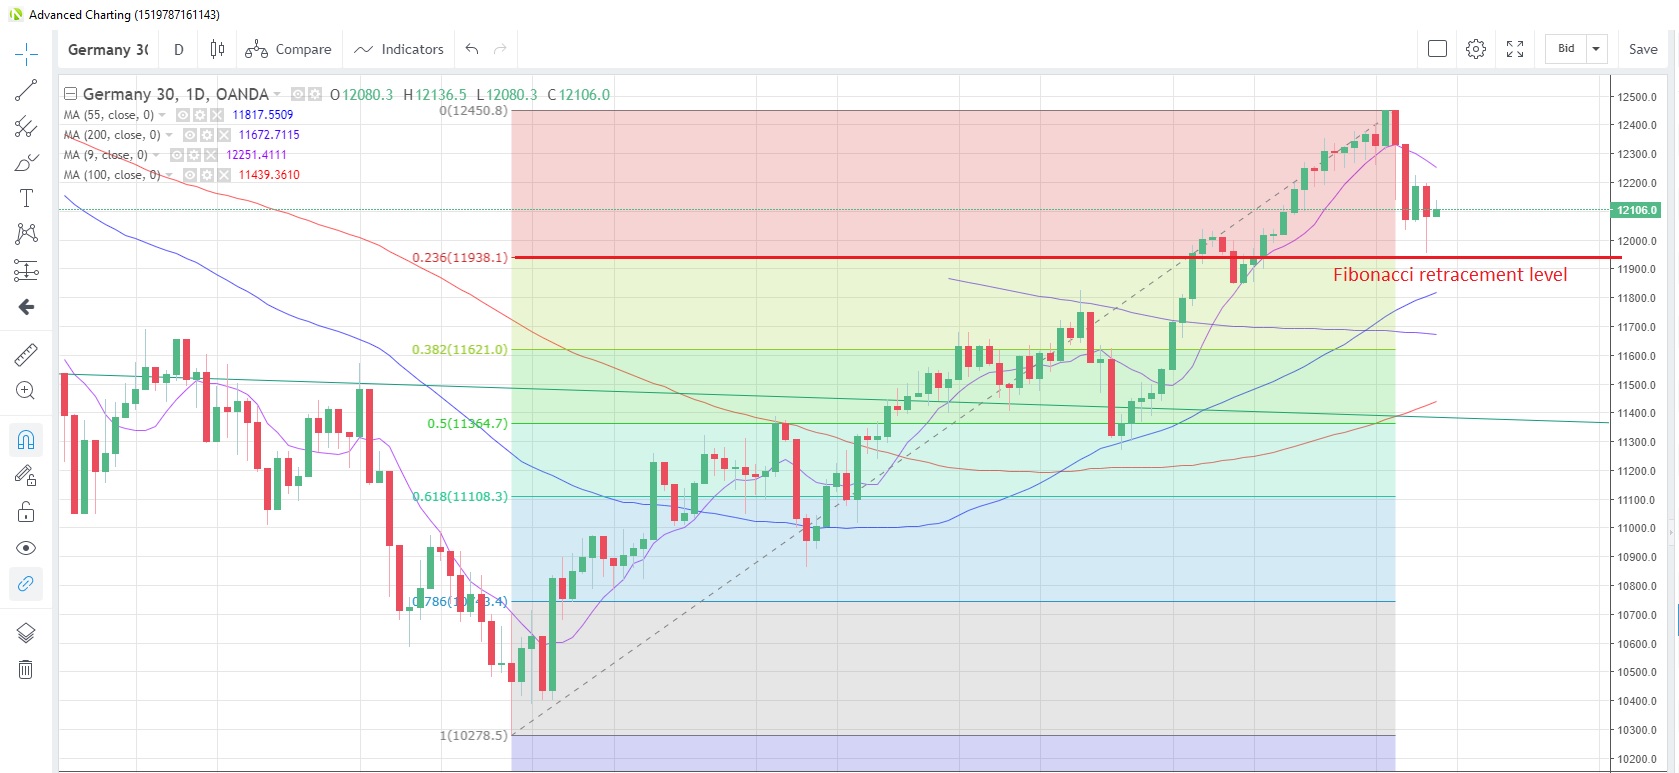
- The Germany30 index fell yesterday, touching the lowest in almost a month as pressure on Wall Street intensified
- The index is still holding above the 23.6% Fibonacci retracement of the rally since December at 11,938
- Germany’s March trade data are due today and are expected to show a narrowing of the trade surplus to EUR18.2 billion from EUR18.7 billion. ECB’s Lautenschlaeger is scheduled to speak.
CN50/USD Daily Chart
Source: OANDA fxTrade
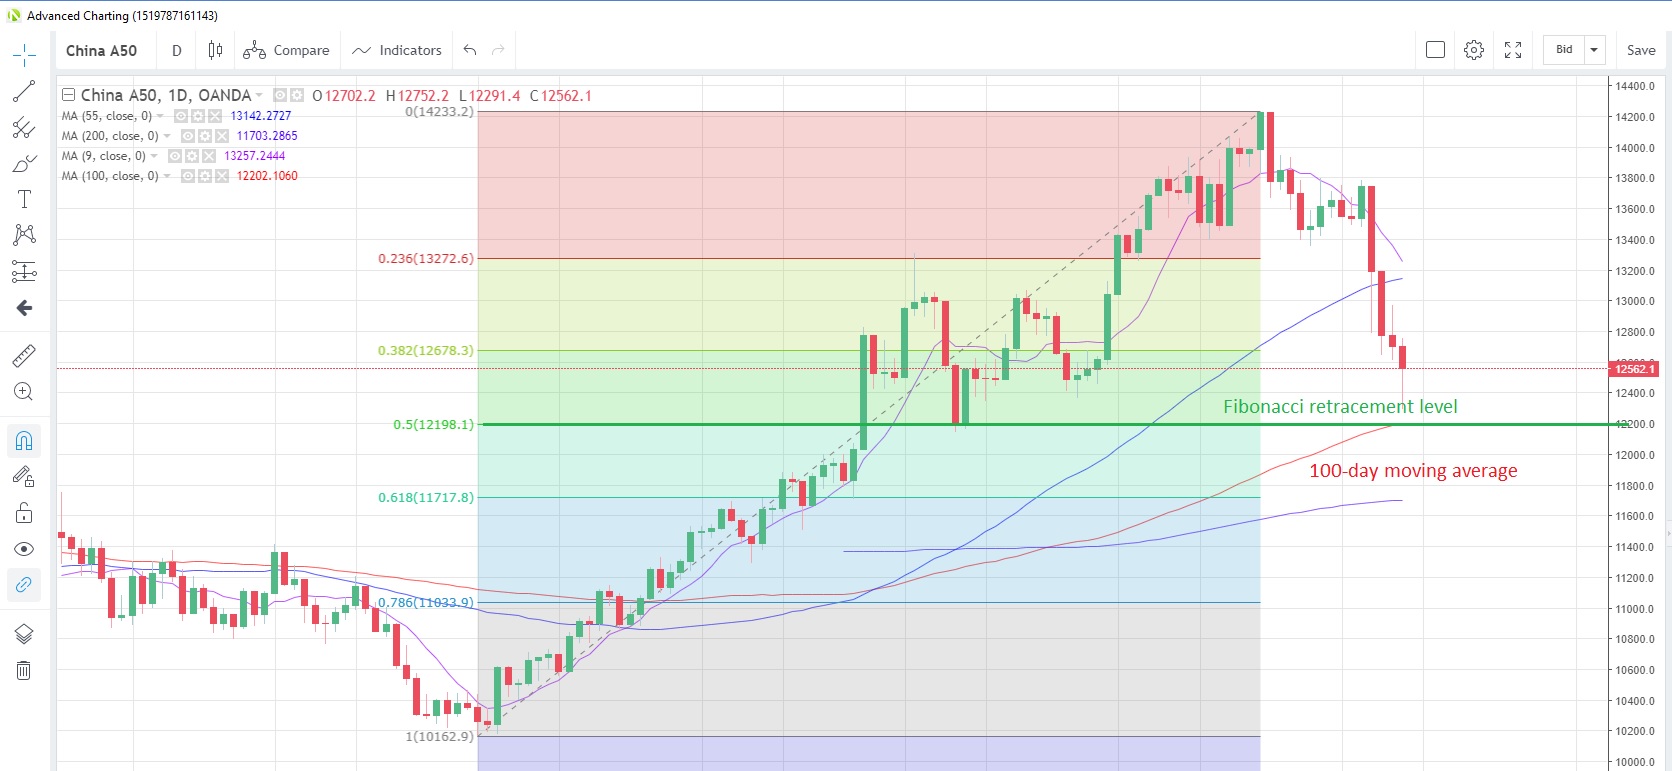
- The China50 index fell for a fourth straight day yesterday amid fears of a trade war escalation after the tariff deadline tonight
- The index dropped to a two-month low but halted the decline near the convergence area of the 100-day moving average at 12,202 and the 50% retracement level of the 2019 rally at 12,198
- China publishes new loans data for April today with a bumper total of 1.2 trillion yuan ($175 billion) expected. This would bring the year-to-date total to more than 7 trillion yuan ($1.02 trillion), a serious injection of liquidity into the corporate world.


