The U.S. economy added more jobs than expected in March, which helped push the US30 index to six month highs. Trump blamed the Fed for slowing the U.S. economy, called for rate cuts. Oil supply concerns out of Libya pushed oil prices higher.
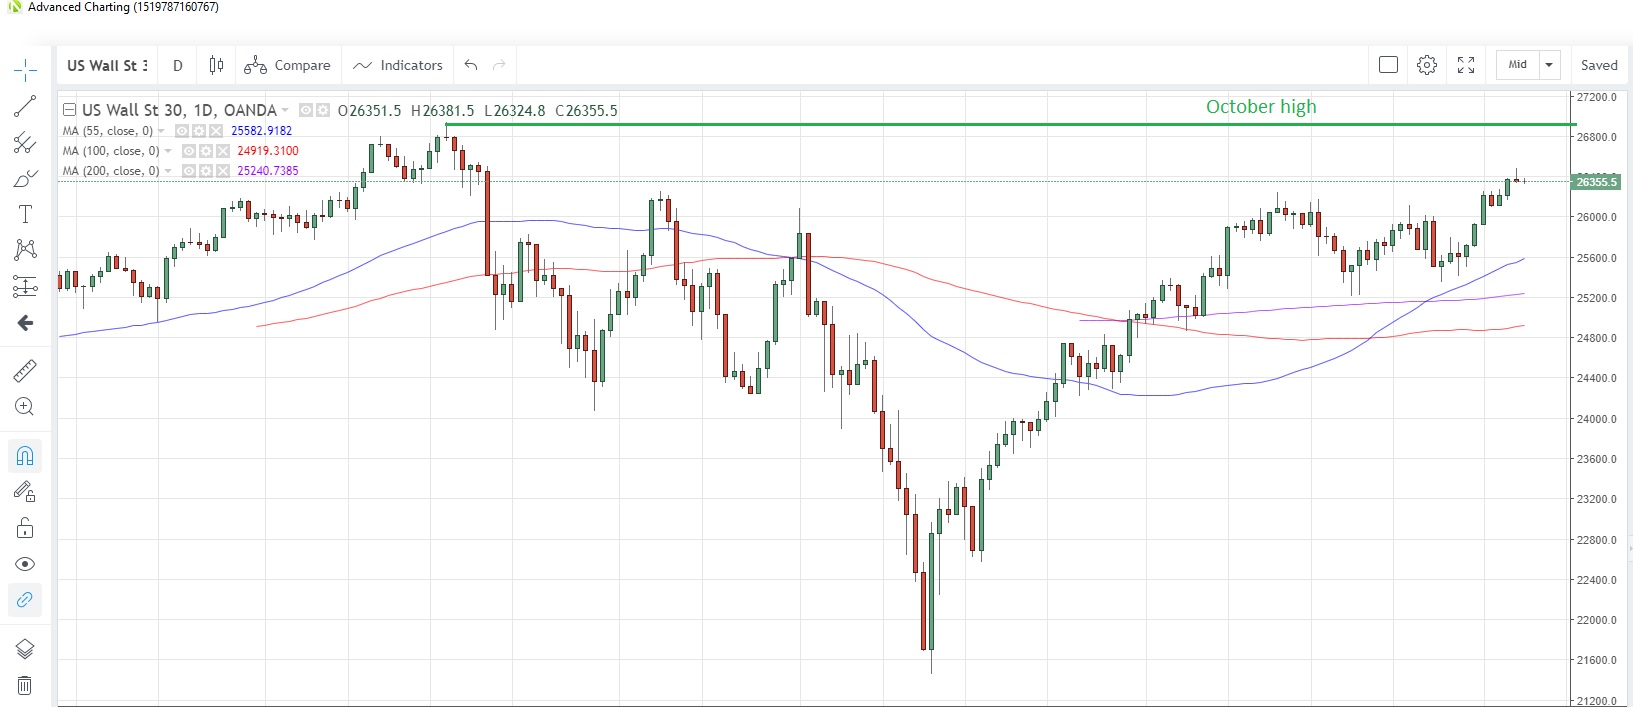
US30USD Daily Chart
Source: OANDA fxTrade
- The US30 index pushed to its highest since Oct. 10 on Friday after U.S. payrolls came in above forecast
- The next possible resistance point could be the October 2018 high of 26,940
- March nonfarm payrolls rose by 196,000, beating economists estimates of a 180,000 gain. Unemployment held steady at 3.8% though average hourly earnings rose 3.2% y/y, less than expected. Today’s calendar only has February factory orders on tap, which are seen falling 0.6% m/m.
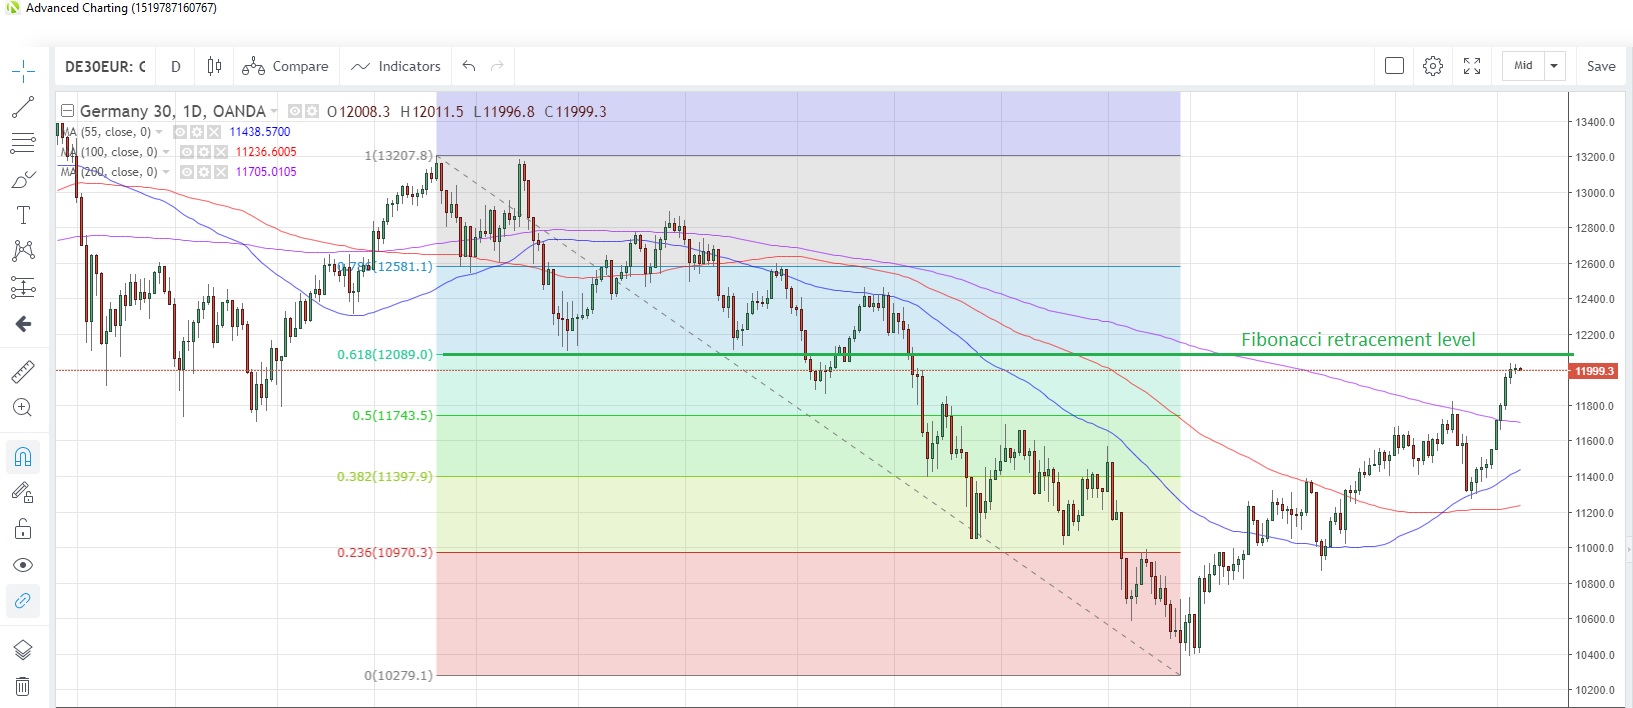
DE30EUR Daily Chart
Source: OANDA fxTrade
- The Germany30 index climbed for a tenth consecutive day on Friday, buoyed by the enthusiasm on Wall Street
- The index failed to match the six-month high seen on Thursday, but the 10-day rising streak was the longest since April-May 2013. The 61.8% Fibonacci retracement of the May-December drop is at 12,089
- German trade data for February are due today, with the surplus seen narrowing to EUR17 billion from EUR18.5 billion in January, the latest survey shows.
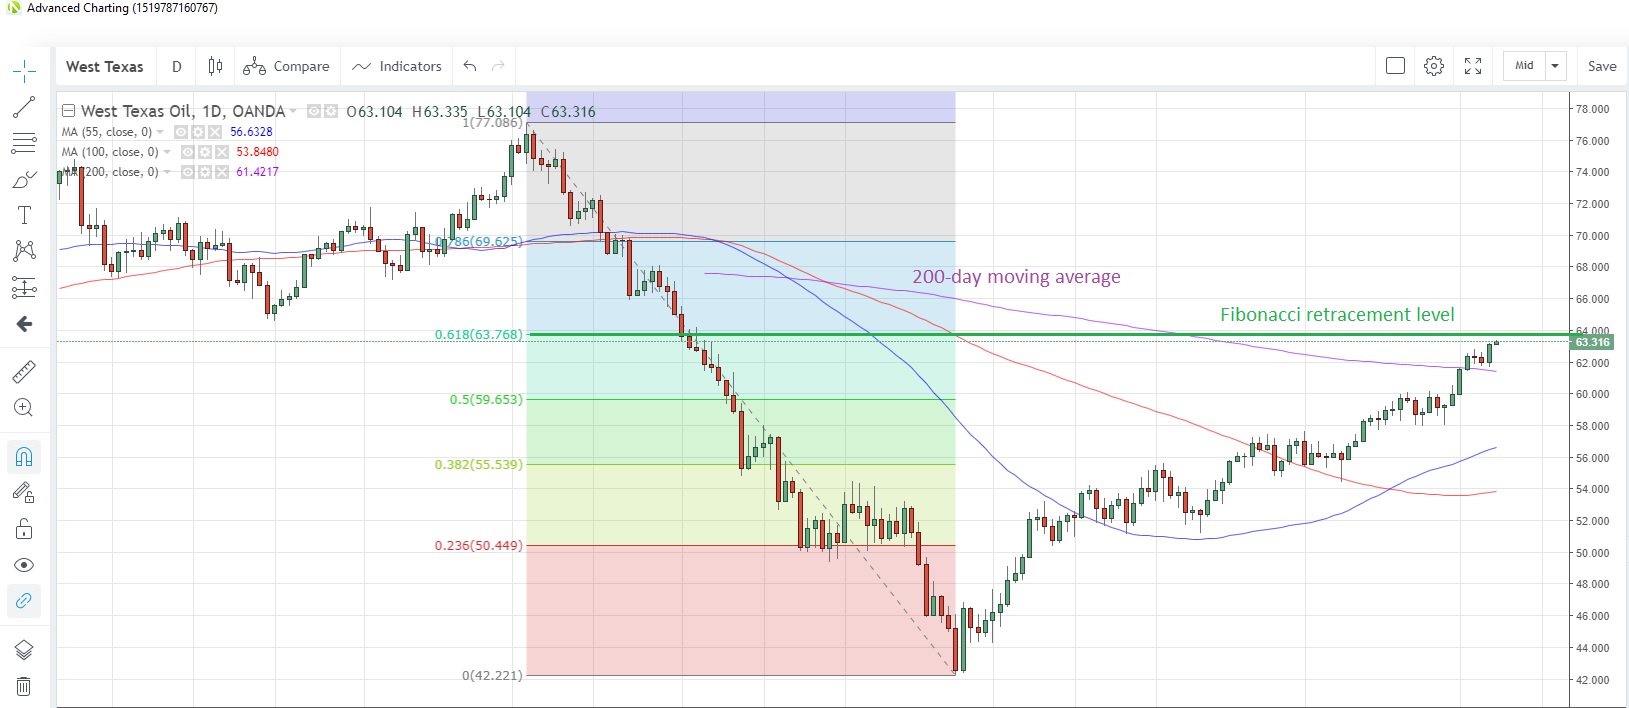
WTICOUSD Daily Chart
Source: OANDA fxTrade
- WTI snapped a two-day losing streak on Friday amid concerns about supply disruptions out of Libya. Prices have pushed higher this morning to hit the highest since Nov. 6
- Prices are nearing the Fibonacci resistance at 63.768, which is 61.8% retracement of the October-December drop. The 200-day moving average offers support at 61.422
- The index measuring the number of US oil drilling rigs in production surged to 831 last week from 816 the previous week. That’s the first increase in seven weeks.


