EUR/USD strongly bullish
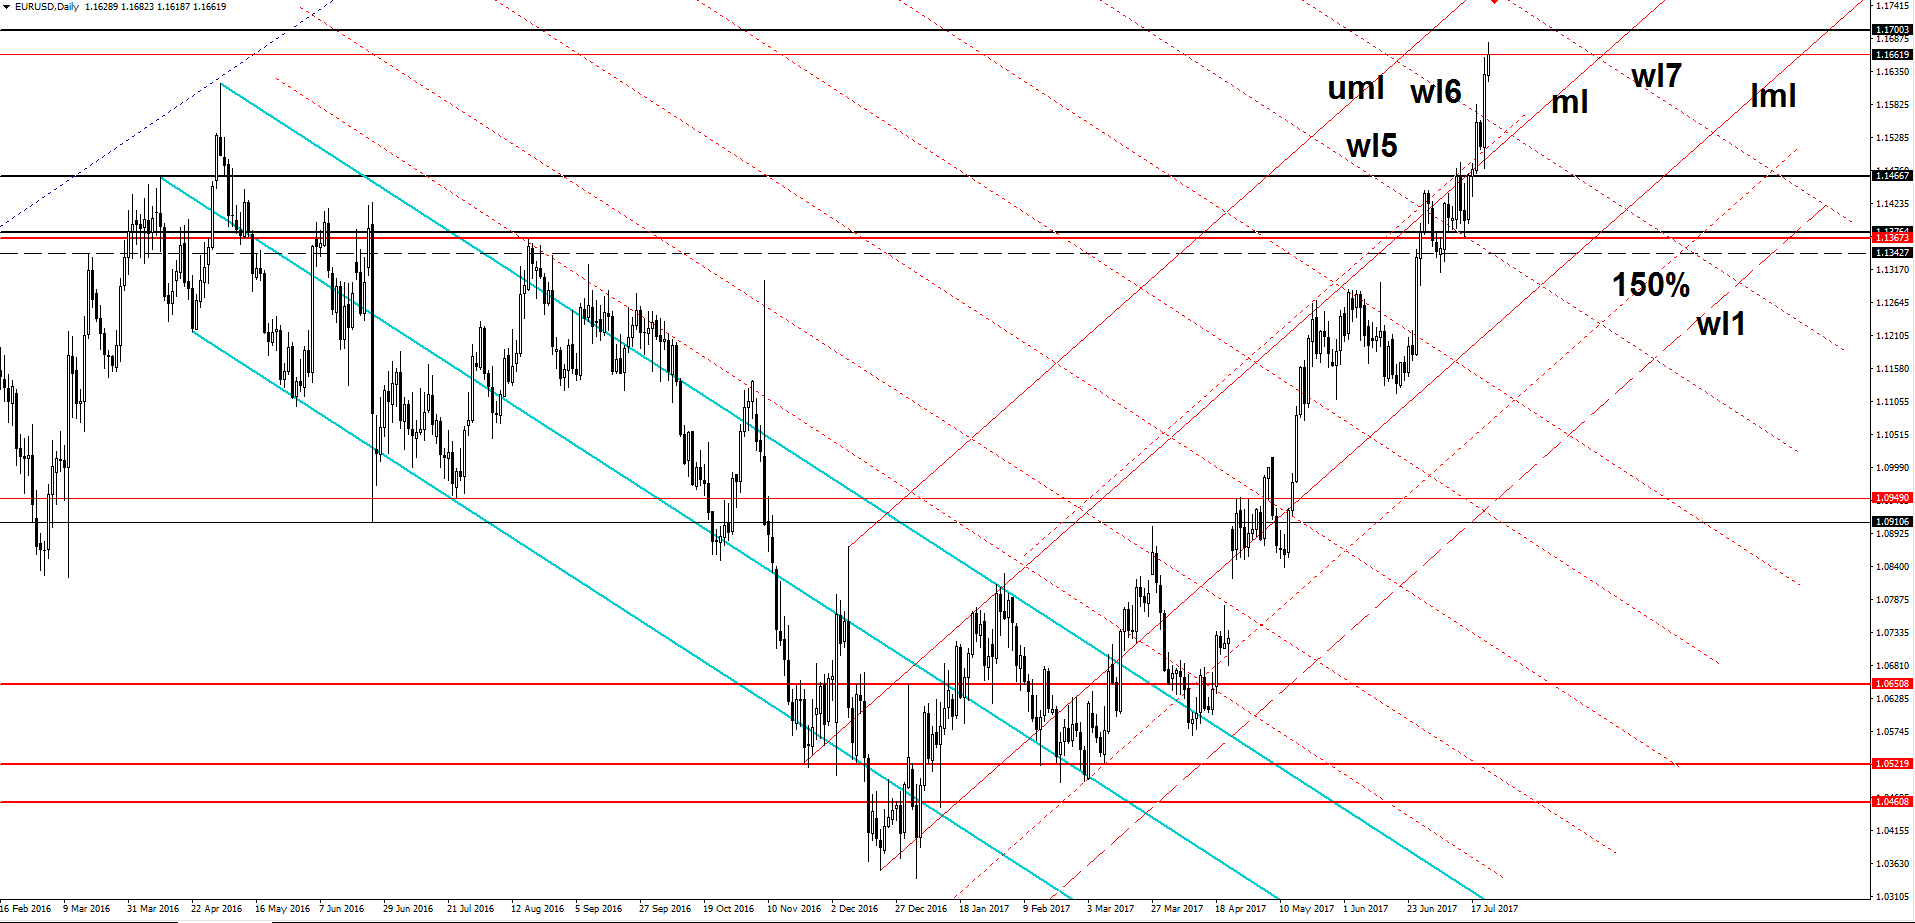
Price rallies and seems unstoppable on the Daily chart, is located above the 1.1660 level and could hit fresh new highs in the upcoming days. Is strongly bullish as the USD is weakened by the USDX’s impressive sell-off.
The index has fallen below the 94.00 psychological level and most likely will resume the bearish momentum, could approach the 92.49 major static support in the upcoming period, a further drop will force the USD to depreciate further versus its rivals.
Remains to see how will react when will touch the 1.1700 psychological level, could find temporary resistance at this static obstacle, but a valid breakout will attract more buyers.

EUR/USD edged higher in the last day and touched the 1.1682 level should climb higher in the upcoming days because the dollar is under massive selling pressure. The next major upside target is at the 1.1712 level, will approach this level because we don’t have any exhaustion sign, another important leg lower will come if the rate will drop and will stabilize below the median line (ml) of the ascending pitchfork.
Could also be attracted by the upper median line (uml) of the ascending pitchfork and by the seventh warning line (wl7) of the former descending pitchfork, could find resistance at this levels.
The outlook will remain bullish as long as is trading within the ascending pitchfork’s body, right now will be better to stay away because we don’t have any trading opportunity.
We may have some action tomorrow because the US and the Euro-zone are to release significant reports, the fundamental factors could take action the lead and could drive the rate, remains to see the direction.
GBP/USD setting up for further increase
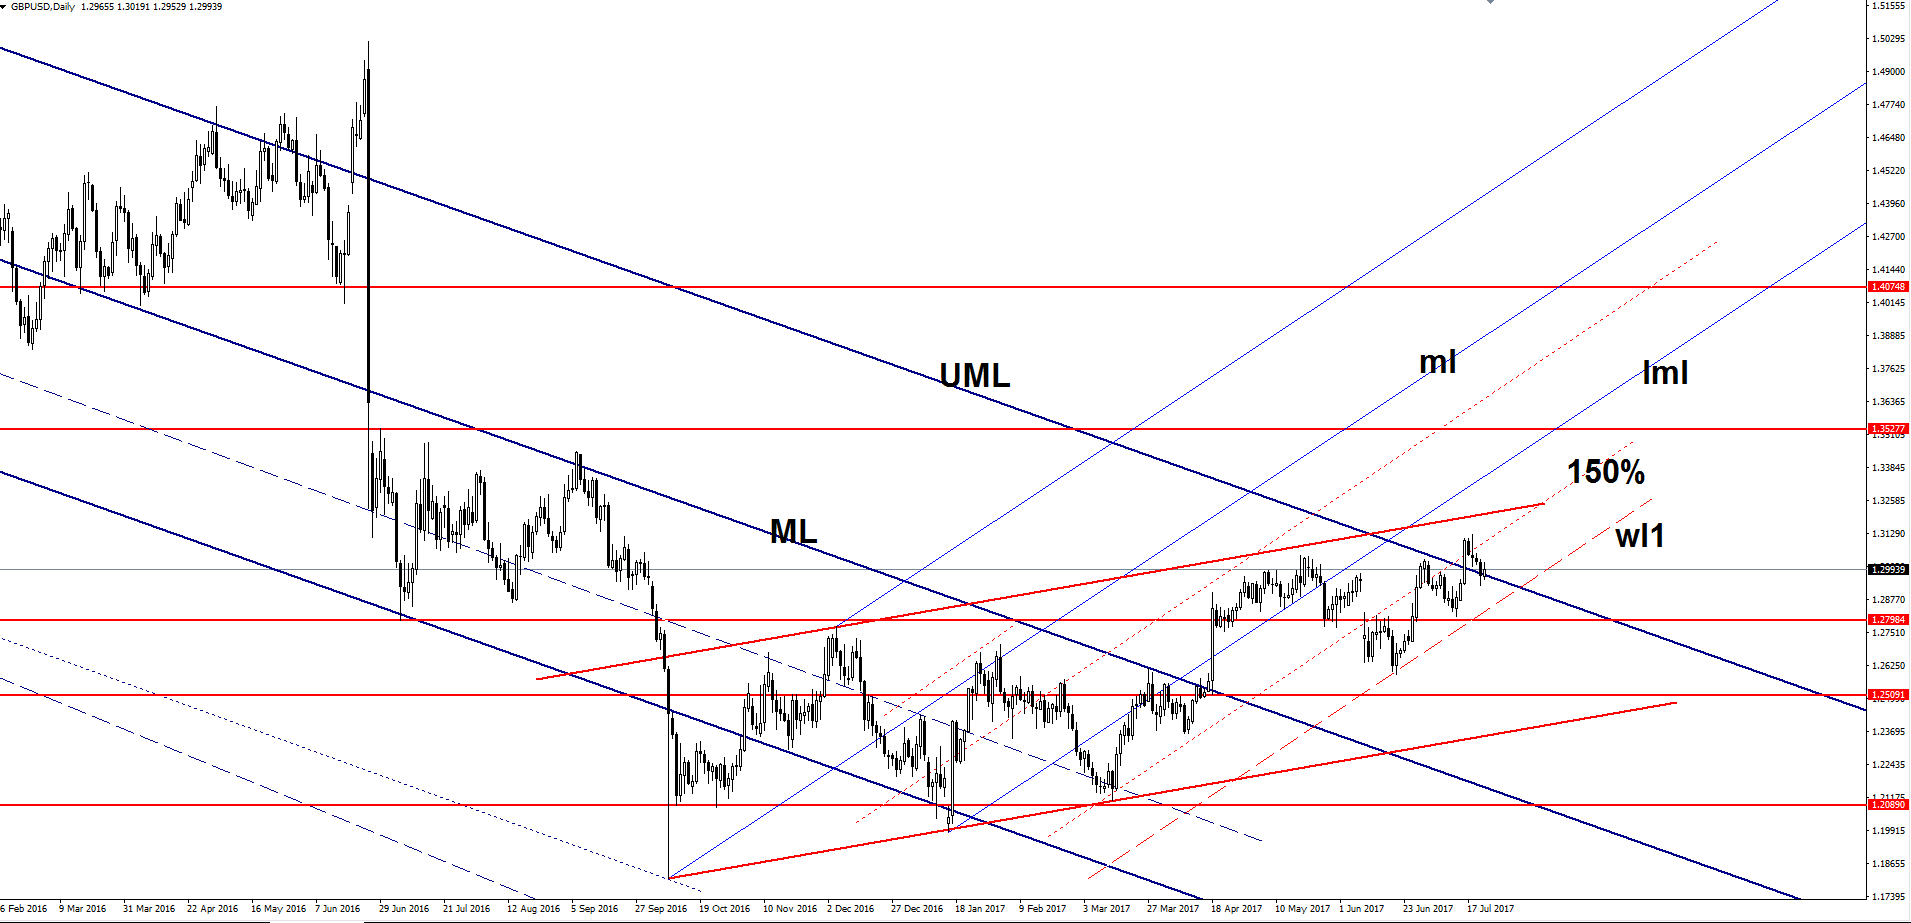
Price surged on Friday and managed to stay above a broken major dynamic resistance, the short retreat was somehow expected after the impressive bullish rally.

Continues to move within the ascending channel, so the perspective is bullish in the upcoming period despite the minor retreat. GBP/USD decreased a little in the previous week after the failure to reach the upside line of the ascending channel .
Has come down to retest the upper median line (UML) of the major descending pitchfork, we may have a buying opportunity if will retest the warning line (wl1) as well. The sentiment will change if the rate will stabilize outside the descending pitchfork’s body.
USD/JPY on the way down
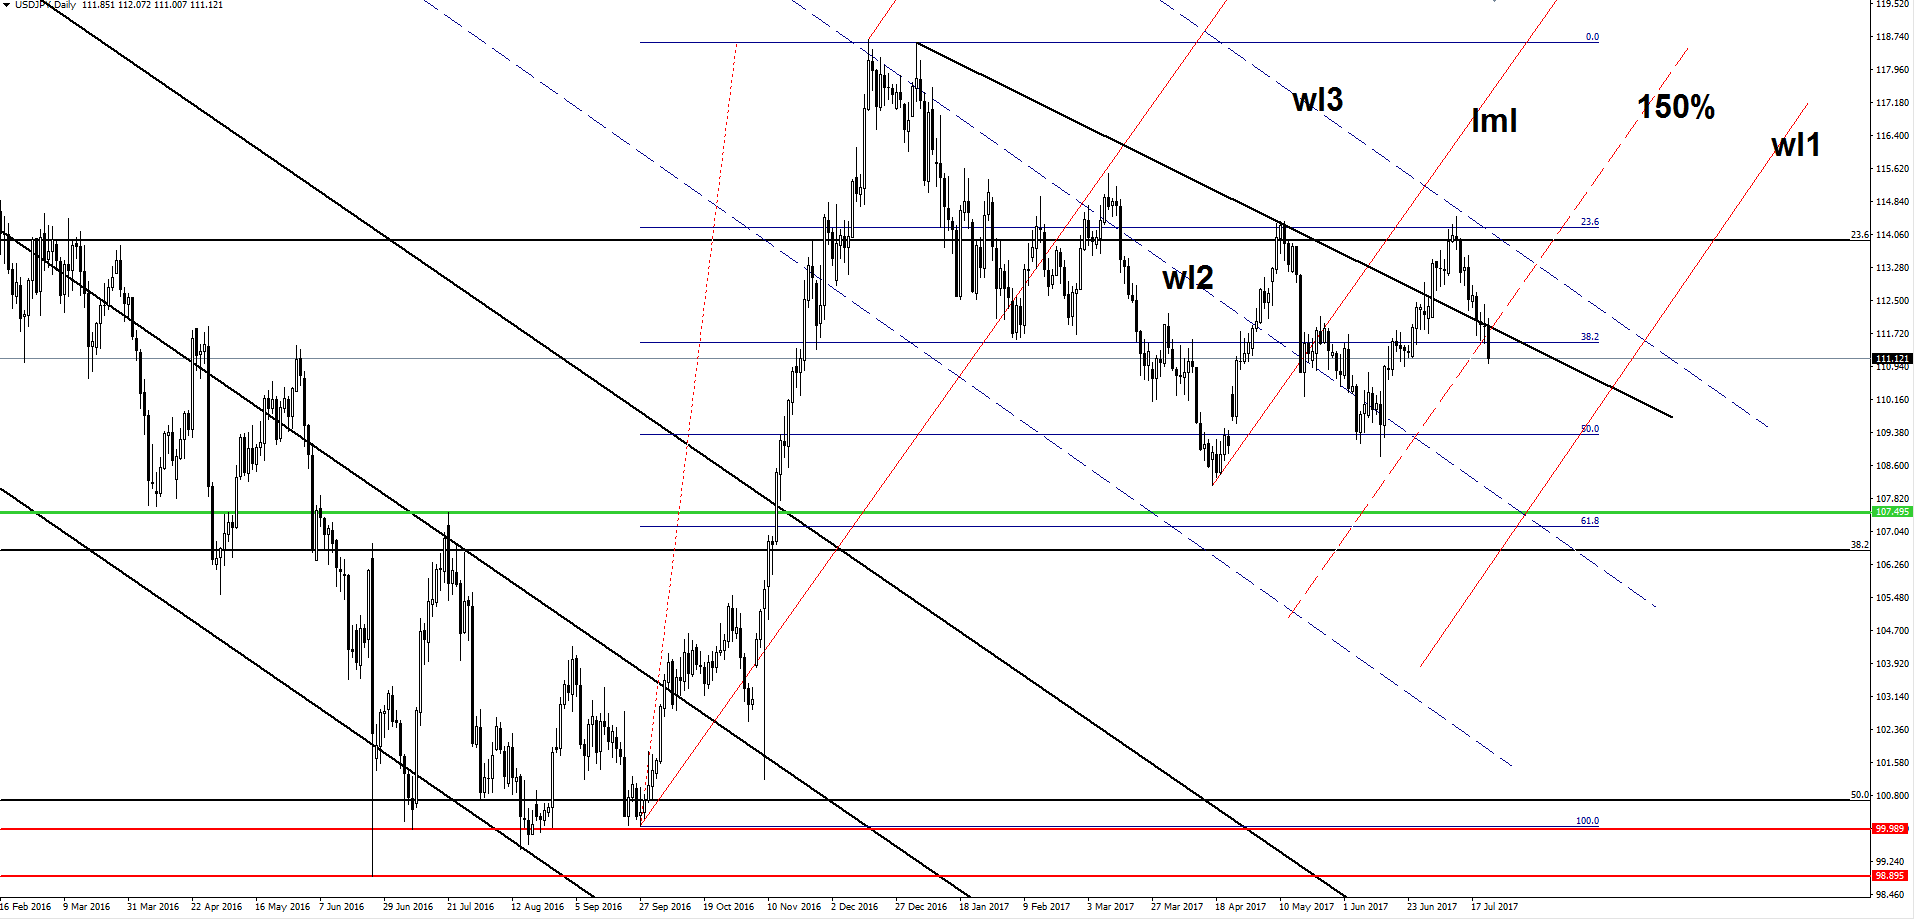
USD/JPY decreased sharply on Friday, signalling that the bears are if full control on the short term, should drop much deeper if the USDX will touch fresh new lows.

Has broken below the black downtrend line and below the 38.2% retracement level and looks determined to drop much below the 111.00 psychological level. Is moving somehow sideways between the 23.6% and the 50% retracement level, could approach the 50% level and the first warning line (wl1) these days. We’ll have a selling opportunity if will come back to test and retest the broken levels.
