Corn
Near Term (Basis December): Bullish
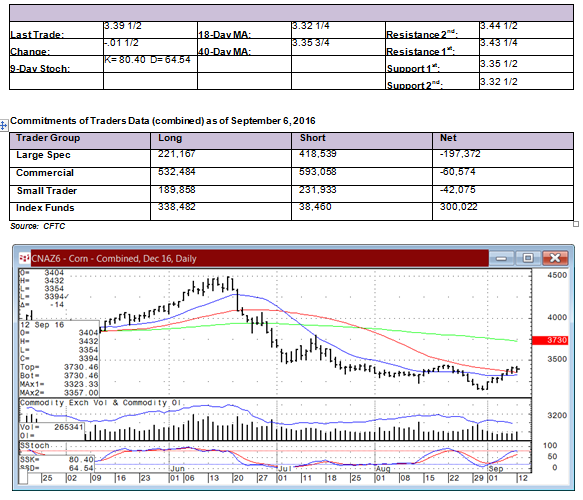
By a small margin, the December Corn chart will retain its near-term bullish outlook in spite of a trading session that was primarily a 'non-technical' session. That major influence should be over today and the chart influences should resume a more prominent portion of the day's price activity. With this as an expectation, we will want to see the December contract remain positioned above the $3.35 1/2 level on a closing basis in order to feel that we can remain biased to the bullish near-term outlook. If Tuesday's trade not only holds shorter-term support above the moving averages but also extend higher, we should start to see a more aggressive short-covering reaction out of the large spec trader group, and this can be a meaningful factor is pushing the futures higher at least over the next few weeks of trading. We would target the 100-day MA resistance level as the place to expect a better rally to reach for.
Long Term: Bearish
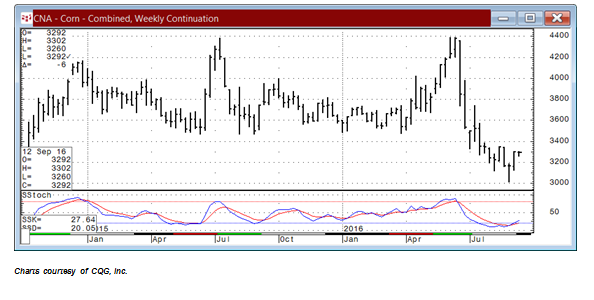
Our long-term technical outlook is bearish. Major resistance is $3.34 3/4, while support is $3.01 and then $2.96 3/4.
Soybeans
Near Term (Basis November): Bearish, looking for a setback
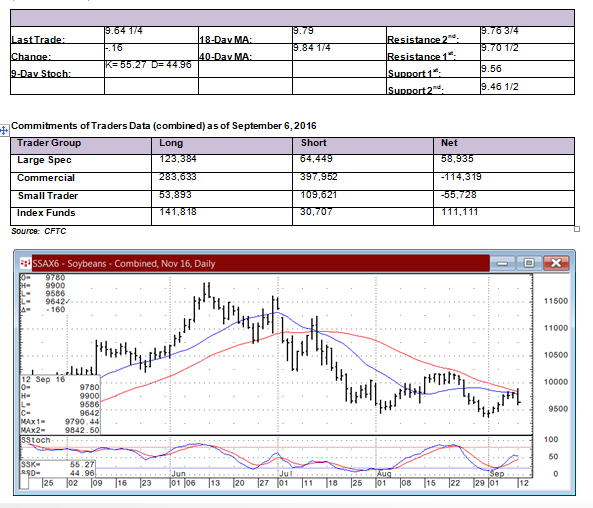
Regardless of the reason, yesterday's trade in the November soybeans generated an outside range day of trading with a lower close following six sessions of modest strength that took the market up into close proximity to the moving average resistance. Yesterday's reversal action and turn down from an early penetration of the MA's will look like a reason for the chart readers to remain bearish and to expect a lower follow through. What we do not want to see from this start on the week is a failure to extend lower and a turn right back higher to threaten a close over yesterday's high at $9.90. That would be a reason to abandon ship as a bear and to start thinking about turning bullish and then looking to see of the buying develops as expected to run the November beans up above the $10.00 psychological level to start attracting even more buying.
Long Term (Basis Weekly Chart): Neutral, weakening
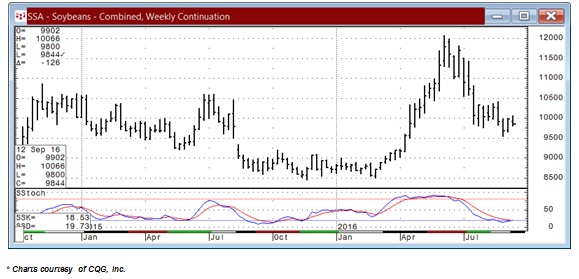
Our long-term technical outlook is neutral. Major resistance for the weekly chart is $10 53 1/2, while support for the weekly chart is $9.50 and then $9.19 3/4.
Wheat
Near Term (Basis December): Bearish, but concerned
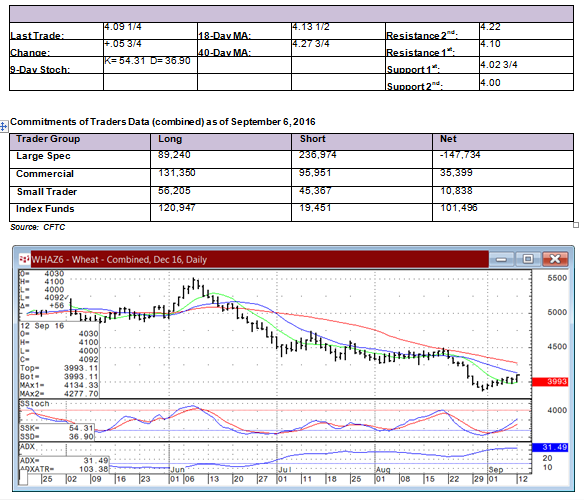
Monday's wheat trade showed a small but choppy trade mid-session centered on the 'non-technical' event scheduled for this morning and then shook off the chop and closed firm. This had some positive chart implications in our view. The rally over the past seven trading days has been modest but enough as of the close yesterday to not only get up through the shorter-term 9-day moving average but also turn the rising ADX lower at a time when the large spec trader is holding a sizable net-short position and has added new shorts for three consecutive weeks now. It will only take a small amount of buying from the close today to penetrate the 18-day MA resistance to start triggering some additional chart-based buying and potentially turn the trend. We are still bearish looking into the end of the week and willing to see the MA resistance cap the upside and turn the market back lower, but we are also very concerned and will only need a close over the 18-day MA to turn and run.
Long Term: Bearish
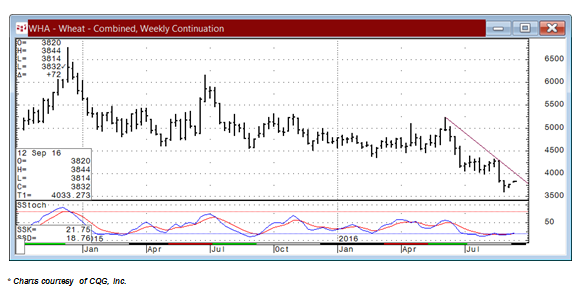
Our long-term technical outlook is bearish. Major resistance is at $4.46, while support is $3.57 1/4 and then $2.82 1/2.
Crude Oil
Near Term (Basis November): Neutral
NOTE: We have changed to the November chart.
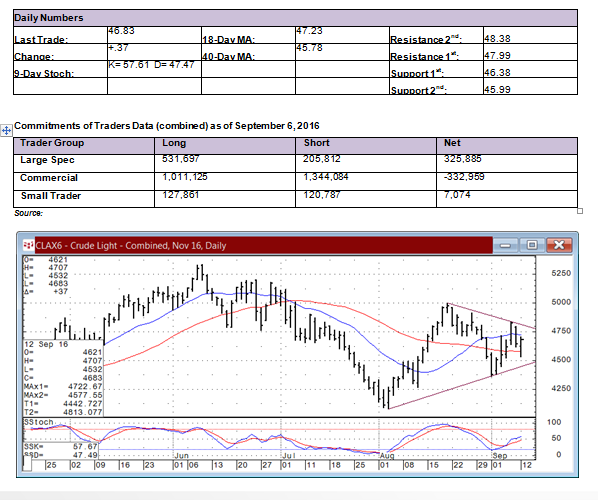
In changing to the November daily chart we see the same consolidation type trading pattern (triangle) that shows the market is in a coiling posture and in a very near-term neutral stance from our perspective on the daily chart. Many classical chart readers will see the moving averages flattening out and becoming of less importance and instead will wait on a trendline breakout from the triangle as a reason to pick the next directional bias in the crude oil market. From a confirmed breakout we can then use the chart pattern to measure a swing count objective. Based on the size of the pattern, we can make a rough estimate now with a bullish breakout leading the chart readers to a goal new $54.00 or a downside breakout having risk to the $38.00 level.
Long Term: Bearish
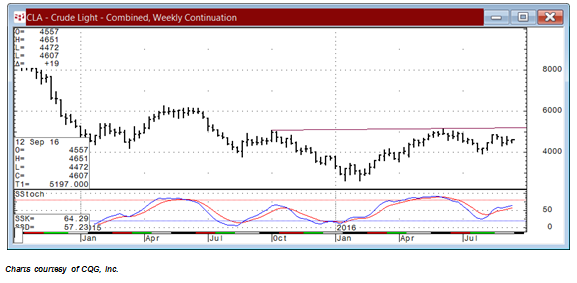
Our long-term technical outlook is bearish. Major resistance is at $51.67, while support is $39.19 and then $35.24.
Feeder Cattle
Near Term (Basis October): Bearish, turning cautious
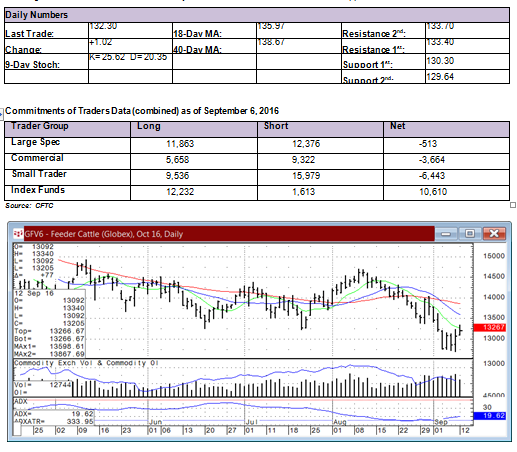
Monday's feeder cattle trade will be a little interesting from a technical perspective in that the consolidation and small base-building effort from last week and then the outside range higher close on Friday immediately led to a higher trade yesterday that never really threatened a lower trade. In addition, the market ran up to and penetrated the shorter-term 9-day moving average resistance as a reason to put the rising ADX at risk the rest of the week. If it turns down in the next day or so and the October futures extend higher, we could see a test of the more important MA and trendline resistance zone overhead. With the large spec trader moving into a small net-short position, a higher follow through could encourage better buying but there is more work to be done and from here we still see a fairly bearish chart read in place that would have to be overcome first.
Long Term: Neutral
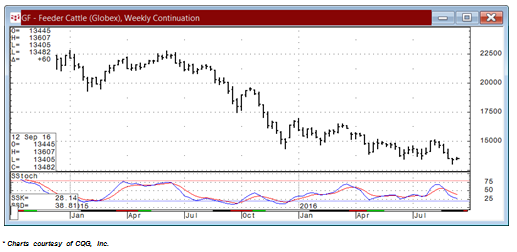
Our long-term technical outlook is bearish. Major resistance is at 146.22 cents, while support is 121.37 and then 106.55 cents.
Live Cattle
Near Term (Basis October): Bearish, but concerned
The October live cattle futures gapped higher and held the gap all session coming out of the limit-up trade on Friday. The strength yesterday was enough to turn the ADX lower after the close last week allowed the market to get up through the shorter-term 9-day moving average resistance which we feel defends the ADX...or leads to a turn down as we saw yesterday. This is supportive to the chart read but on its own not bullish and in this case not enough to chase us to a neutral stance...yet. The futures need to close above yesterday's high at 106.52 cents in order for us to abandon ship as a bear. This would be a start down the road to thinking bullish technical thoughts and the weekly reversal pattern to the upside provided by the strong close on Friday at least provides a reason (in addition to the ADX turn down now) to expect a higher follow through.
Long Term: Bearish
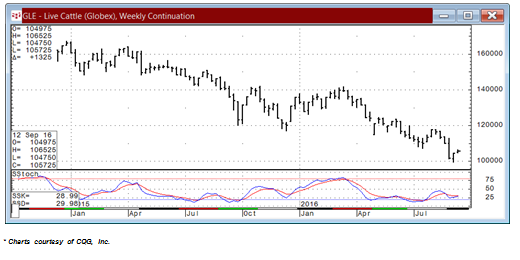
Our long-term technical outlook is bearish. Major resistance is at 107.10 cents, while support is 97.12 and then 94.57 cents.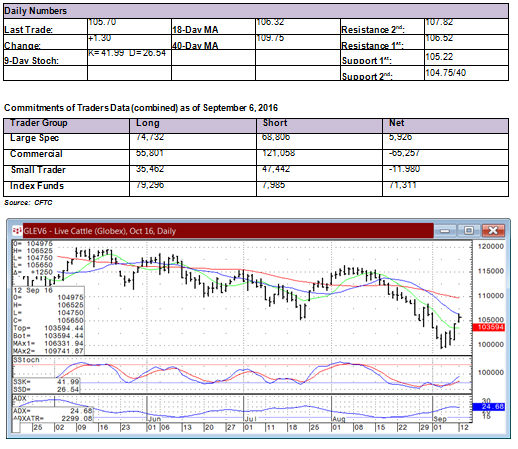
Lean Hogs
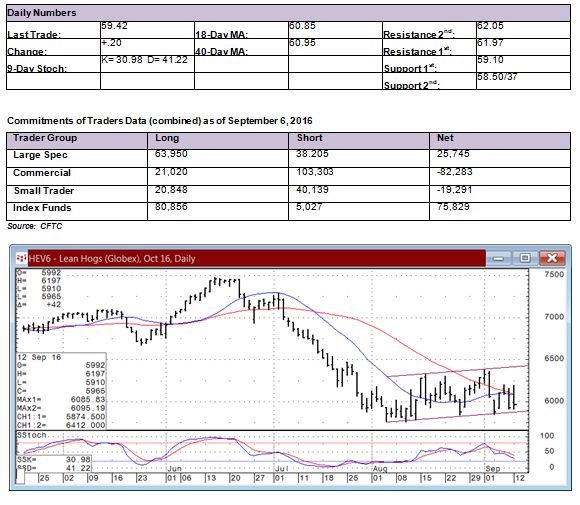
Near Term (Basis October): Neutral, weakening
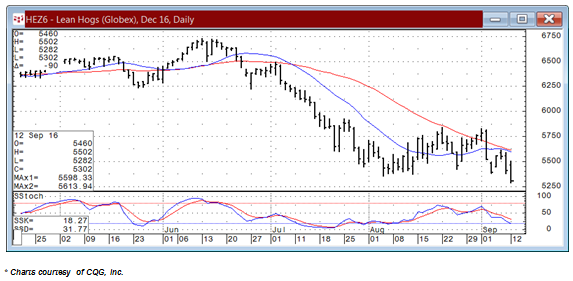
The October Lean Hog futures continue to coil in a choppy manner with the past month of trading captured for the most part within a channel that we have highlighted on the October chart. We would note that the other contract months are biased lower already, but we will not change to the December chart for another two weeks, so for now we see a neutral to weakening chart read with the front month October contract holding in better than the rest of the market due in part to the lean hog index chart that is down trending but running enough premium to the futures to act as a mildly supportive feature for now.
Long Term: Bearish
Our long-term technical outlook is bearish. Major resistance is at 66.82 cents, while support is 54.72 and then 51.80 cents.
Silver
Near Term (Basis December): Neutral, leaning bearish
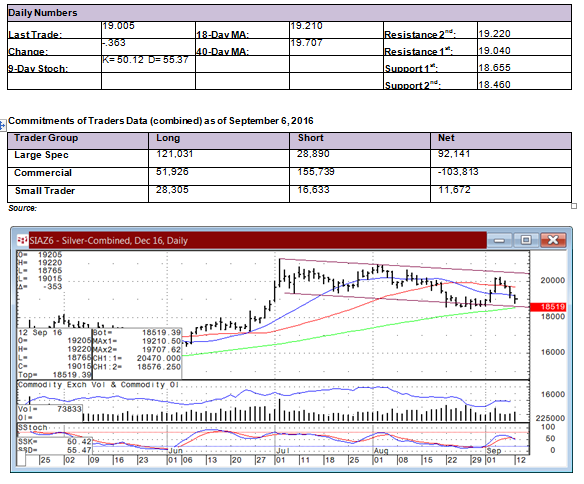
Monday's start to the new week held a fairly negative implication for the Silver market in extending down through the 18-day moving average and pushing towards the only remaining support of any consequence near $18.500 where late August lows along with the bottom of a channel and the longer-term 100-day MA all come together in a tight range. The market either holds here and turns back higher or we feel there is a big bearish downside breakout about to occur that unleashes a sizable amount of large spec trader long liquidation selling pressure. This trader group is about to get tested.
Long Term: Bullish
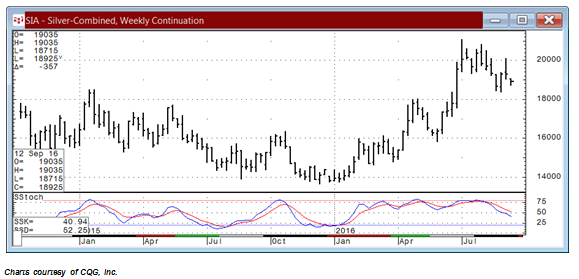
Our long-term technical outlook is bullish. Major resistance is at $21.095, while support is $18.030 and then $17.105.
Gold
Near Term (Basis October): Bearish, but cautious
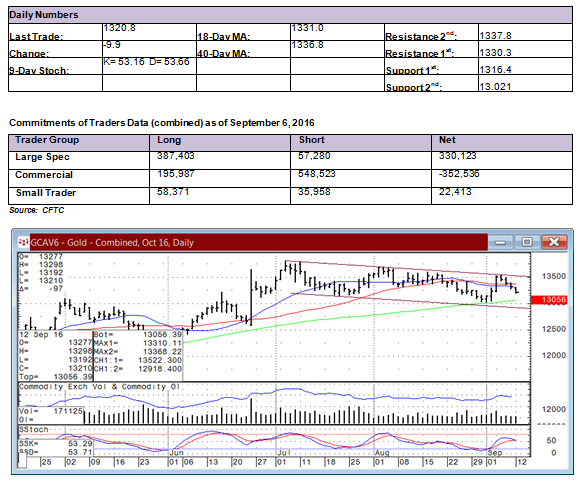
We will use a second consecutive lower trading day under the 18-day and 40-day moving averages as a reason to take on a cautiously bearish chart outlook. There is still quality support under the market near the $1300.0 level where the 100-day MA, the reversal low from the first of the month, and the bottom end of the channel all combine to make for another support zone that needs to be broken through in order to expect an acceleration to the downside from the large spec trader group that has been holding a sizable net-long and is thought to have added to their longs a week ago on the small rally that was pressed back down and away from the top of the channel. By a small margin, the daily stochastic crossed for a fresh momentum sell signal as an added weak talking point for the gold market this week.
Long Term: Bullish, weakening
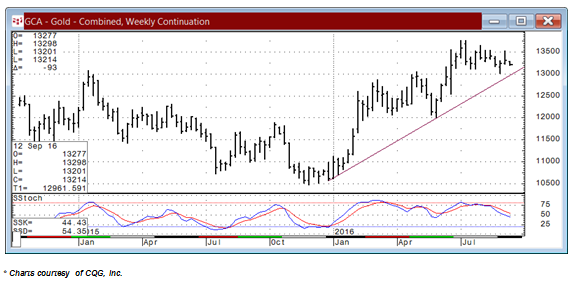
Our long-term technical outlook is bullish. Major resistance is $1377.5, while support is $1253.7 and then $1199.0.
Near Term (Basis Daily Continuation Chart): Neutral, weakening
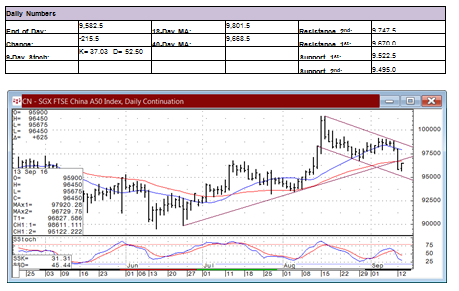
Monday's trade was sharply lower as a weak ending to last week from a chart standpoint added selling pressure to the market and then added even more when the combination of the 40-day moving average and the trendline support was violated. The later bounce back that will be part of Tuesday's session looks to test the breakout level near 9,700.0 and then we see later into this week whether the index can extend the weakness enough to create an outright bear market outlook, or tries to rebound from the huge selloff session to start the week and in the process consolidate in between the MA's in a very near-term neutral stance...which at this point would appear to be the preferred shorter-term outlook.
Long Term: Bullish
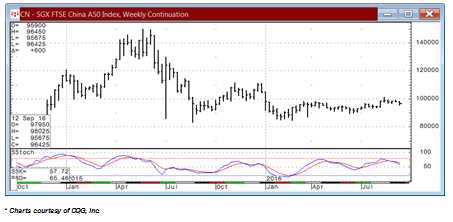
Our long-term technical outlook is bullish. Major resistance is $11,160.0, while support is $8,950.0 and then $8,712.5.

