EURUSD
The Euro maintains negative tone after last Friday’s sharp fall followed rejection at 1.2570, trendline resistance and nearly fully retraced 1.2357/1.2597 upleg. Long red candle of last Friday, as well as weekly bearish engulfing, suggest further weakness, as the pair opened the week with about 20 pips gap-lower, which was covered on a bounce to 1.24 zone, initial barrier and previous range floor. Next strong barrier lies at 1.2450, Fibonacci 38.2% of 1.2597/1.2360 descend and previous bull-channel support line, break of which would ease immediate downside pressure and allow for further correction towards 1.25 level, previous congestion floor and Fibonacci 61.8%, where extended rallies should be capped, guarding pivotal 1.2570/1.2600 resistance zone, former peaks, reinforced by daily Kijun-sen line. Overall bears, however, see limited consolidative action, preceding fresh weakness, on a clear break below pivotal 1.2357 support, to open next targets at 1.2100, bull-trendline, connecting 2005 and 2010 lows and 1.2042, 24 July 2012 low.
Res: 1.2400; 1.2450; 1.2478; 1.2500
Sup: 1.2373; 1.2357; 1.2300; 1.2265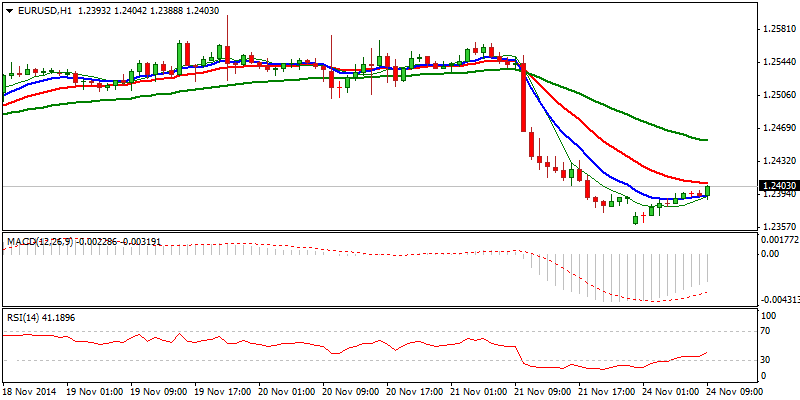
EURJPY
Near-term structure weakened after the price fell sharply last Friday, leaving near-term top at 149.12 and signaling further correction. Friday’s close in red, justifies last Thursday’s Shooting Star, along with weekly Doji with long upper shadow, signaling hesitation ahead of psychological 150 barrier. Initial support was found at 145.57, Fibonacci 23.6% of 134.12/149.12 rally, reinforced by 4-hour 55EMA and more significant daily 10SMA. Break and close below here to confirm negative stance for further easing towards 143.40, Fibonacci 38.2% retracement. Corrective attempts should be ideally capped at 147 zone, Fibonacci 38.2% of 149.12/145.57 downleg, reinforced by 4-hour Tenkan-sen/Kijun-Sen bear cross, to maintain negative near-term tone. Otherwise further extension higher would sideline downside risk, with break above 147.75/148, Fibonacci 61.8% / Friday’s intraday highs, to signal higher low formation and shift focus towards 149.12 peak.
Res: 146.50; 147.00; 147.35; 147.75
Sup: 145.57; 145.28; 145.00; 144.77 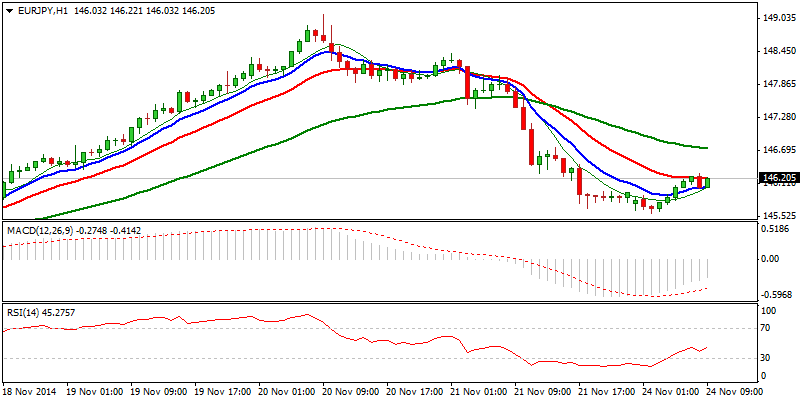
GBPUSD
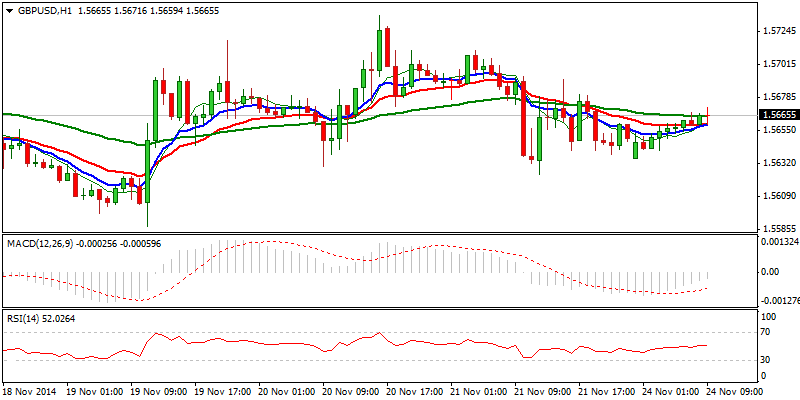
The pair trades in extended consolidation above fresh lows at 1.5590, with upside attempts so far being capped by descending daily 10SMA. Last Friday’s and weekly close in red, maintain overall negative structure, which favors resumption of larger downtrend from 1.7189 peak, towards next target at 1.5373, Fibonacci 76.4% retracement of 1.4812/1.7189 ascend.
Only break above initial 1.5736 barrier and 1.5765, daily Tenkan-sen line, would sideline immediate downside risk, while break and close above 1.58, Fibonacci 61.8% of 1.5939/1.5590 descend, is required to spark stronger correction.
Res: 1.5700; 1.5736; 1.5765; 1.5805
Sup: 1.5624; 1.5590; 1.5550; 1.5505
USDJPY
The pair enters near-term sideways mode, above 117.33, where pullback from fresh high at 118.96, found support for now. Last Friday’s close in red, did not have more significant impact on overall bulls, confirmed by the fifth positive weekly close, with overall action being underpinned by ascending daily 10SMA/Tenkan-sen line at 116.85, which marks breakpoint and close bellow here to signal further acceleration lower. Otherwise, prolonged consolidation would precede fresh attempts higher, with higher base confirmation seen on a rally above 118.35 lower tops, for possible retest of 118.96 top.
Res: 118.00; 118.35; 118.71; 118.96
Sup: 117.56; 117.33; 117.00; 116.85 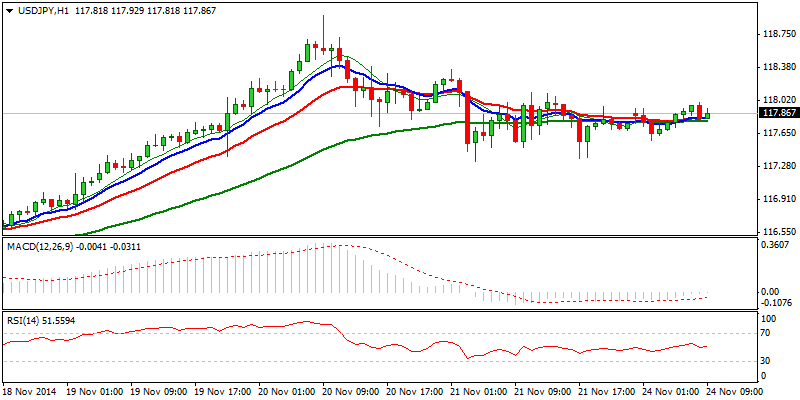
AUDUSD
The pair maintains overall negative tone, with near-term price action consolidating above key support at 0.8539. Friday’s positive close and probe above 0.87 barrier, was capped by descending daily 20SMA, however, near-term structure holds positive tone and looks for further upside. Sustained break above 0.8700/20 barriers, psychological barrier / recovery high, reinforced by daily Kijun-sen line, is seen as minimum requirement to maintain positive tone for test of 0.8745/60 barriers and possible extension to pivotal 0.88 hurdle. On the other side, weekly close in red signals limited upside attempts and eventual attempt through pivotal 0.8539 support, to resume larger bears.
Res: 0.8700; 0.8720; 0.8745; 0.8763
Sup:0.8659; 0.8603, 0.8564; 0.8539 
AUD/NZD
The pair resumed downmove from 1.13 top after completing the first stage, 1.0980/1.1301 ascend, with fresh weakness through psychological 1.10 support, dipping to 1.0931, ticks away from key 1.0914, low of 22 Sep and 1.0910, 200SMA. Consolidative action above 1.0931 low, which peaked above 1.10 barrier, marked last Friday’s positive close, which may signal prolonged consolidation before eventual attack at key support. However, overall tone remains negative, with weekly close in red, suggesting limited corrective action, currently capped at 1.10 zone, before bears regain control.
Res: 1.0972; 1.0985; 1.1020; 1.1056
Sup: 1.0963; 1.0931; 1.0914; 1.0910 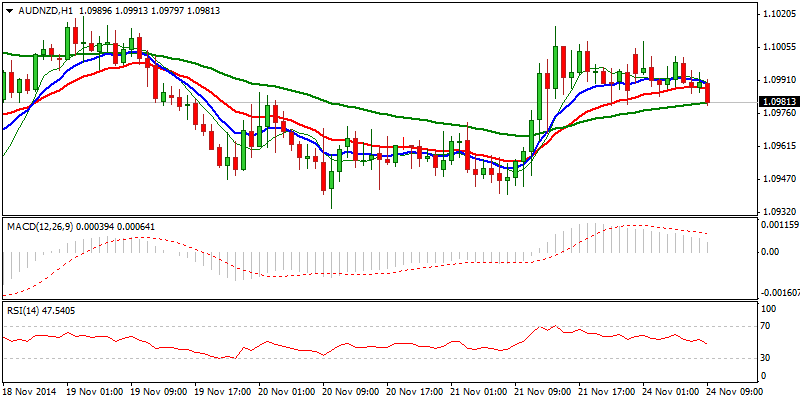
XAUUSD
Spot Gold’s near-term structure remains positive, following renewed attempt above 1200 barrier, which peaked at 1207, Fibonacci 61.8% of 1255/1131 descend. Friday’s positive close at 1200 and the third consecutive weekly positive close, sees the upside favored, with clearance of 1207 barrier, to open 1214, near-term bull-channel resistance, above which to confirm further acceleration higher. Higher base, left at 1175, marks pivotal support, above which corrective dips should be contained. Daily 10/20SMA’s bull-cross at 1179, underpins the action.
Res: 1200; 1204; 1207; 1214
Sup: 1191; 1186; 1179; 1175 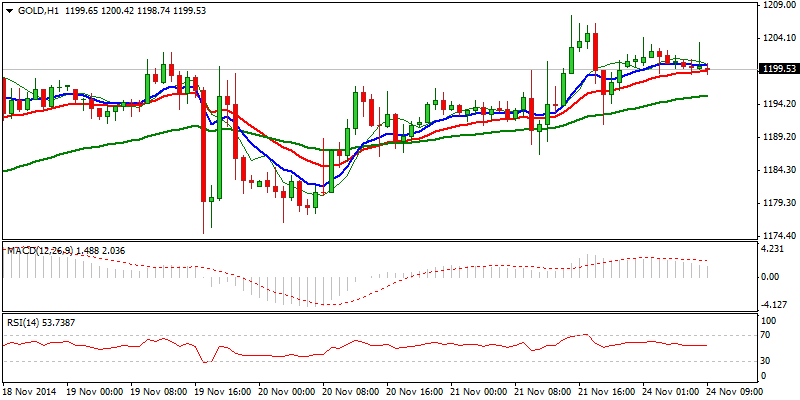
- English (UK)
- English (India)
- English (Canada)
- English (Australia)
- English (South Africa)
- English (Philippines)
- English (Nigeria)
- Deutsch
- Español (España)
- Español (México)
- Français
- Italiano
- Nederlands
- Português (Portugal)
- Polski
- Português (Brasil)
- Русский
- Türkçe
- العربية
- Ελληνικά
- Svenska
- Suomi
- עברית
- 日本語
- 한국어
- 简体中文
- 繁體中文
- Bahasa Indonesia
- Bahasa Melayu
- ไทย
- Tiếng Việt
- हिंदी
Daily Market Outlook: November 24, 2014
Latest comments
Loading next article…
Install Our App
Risk Disclosure: Trading in financial instruments and/or cryptocurrencies involves high risks including the risk of losing some, or all, of your investment amount, and may not be suitable for all investors. Prices of cryptocurrencies are extremely volatile and may be affected by external factors such as financial, regulatory or political events. Trading on margin increases the financial risks.
Before deciding to trade in financial instrument or cryptocurrencies you should be fully informed of the risks and costs associated with trading the financial markets, carefully consider your investment objectives, level of experience, and risk appetite, and seek professional advice where needed.
Fusion Media would like to remind you that the data contained in this website is not necessarily real-time nor accurate. The data and prices on the website are not necessarily provided by any market or exchange, but may be provided by market makers, and so prices may not be accurate and may differ from the actual price at any given market, meaning prices are indicative and not appropriate for trading purposes. Fusion Media and any provider of the data contained in this website will not accept liability for any loss or damage as a result of your trading, or your reliance on the information contained within this website.
It is prohibited to use, store, reproduce, display, modify, transmit or distribute the data contained in this website without the explicit prior written permission of Fusion Media and/or the data provider. All intellectual property rights are reserved by the providers and/or the exchange providing the data contained in this website.
Fusion Media may be compensated by the advertisers that appear on the website, based on your interaction with the advertisements or advertisers.
© 2007-2025 - Fusion Media Limited. All Rights Reserved.
