EURUSD
The Euro remains supported in the near-term, as last Friday’s acceleration left higher base at 1.24 zone and cracked pivotal 1.2576 barrier. Sustained break here and 1.2590, bear-trendline off 1.2884, 5 Oct daily lower top, is required to confirm near-term bottom at 1.2357 and open way for further recovery. Positive daily and weekly closes, along with existing daily RSI/MACD bullish divergence support the notion. Daily Kijun-sen line and 50% retracement of 1.2884/1.2357 downleg at 1.2621, marks immediate resistance, ahead of 1.27 zone, daily cloud base and next pivotal barrier at 1.2763/69, 28/29 Oct lower tops. Corrective actions on overbought hourly studies, should ideally find support at 1.2500/1.2490 zone, previous consolidation tops and near 50% of 1.2397/1.2576 upleg, to maintain fresh bulls, otherwise, deeper pullback would signal further consolidation, which should be contained above 1.24 base.
Res: 1.2576; 1.2590; 1.2621; 1.2683
Sup: 1.2512; 1.2490; 1.2465; 1.2425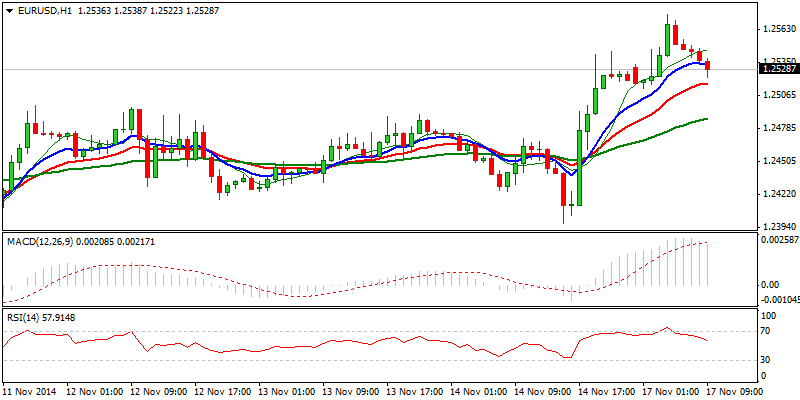
EURJPY
The pair enters near-term corrective phase after break above key 145.67 barrier peaked at 146.51, but failed to sustain break. Subsequent pullback probes below psychological 145 support, with 144.82, Fibonacci 38.2% of 142.08/146.51/hourly 55EMA, being tested so far and further dips towards 144.30, mid-point of 142.08/146.51 upleg and psychological 144 handle, not ruled out. Overall picture remains bullish and sees scope for fresh bull-phase after denting pivotal 145.67 resistance. Positive close on daily and weekly chart is supportive and keeps psychological 150 barrier, also Fibonacci 138.2% projection, in near-term focus.
Res: 145.55; 145.83; 146.00; 146.51
Sup: 144.82; 144.30; 144.00; 143.77 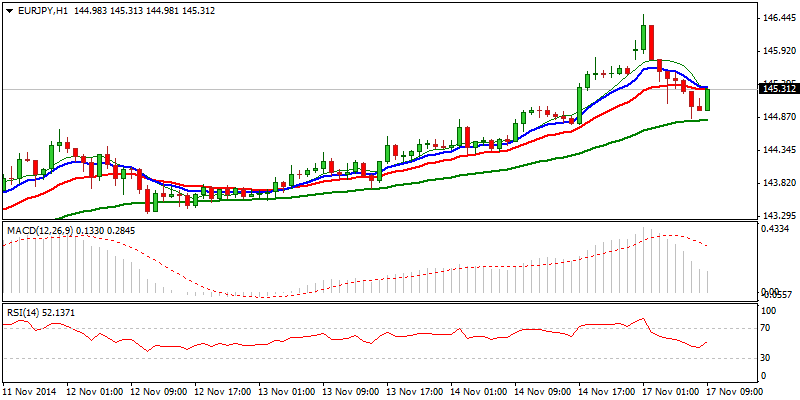
GBPUSD
Cable maintains negative tone after last week’s acceleration broke and closed below 1.5720, Fibonacci 61.8% retracement of larger 1.4812/1.7189 ascend. Fresh weakness probed levels below 1.56 handle, where temporary support was found. Subsequent bounce, signaled by Friday’s Hammer, suggests corrective action, ahead of fresh weakness, which targets 1.5385/75, 100% expansion of the third wave from 1.6522 / Fibonacci 76.4% of 1.4812/1.7189 ascend. Corrective rally looks for the next strong barrier at 1.58 zone, Fibonacci 61.8% of 1.5939/1.5591 / daily Tenkan-sen line, where gains should be ideally capped. Key near-term barrier lies at 1.5940 zone and only break here would sideline bears.
Res: 1.5734; 1.5765; 1.5805; 1.5857
Sup: 1.5661; 1.5662; 1.5646; 1.5590 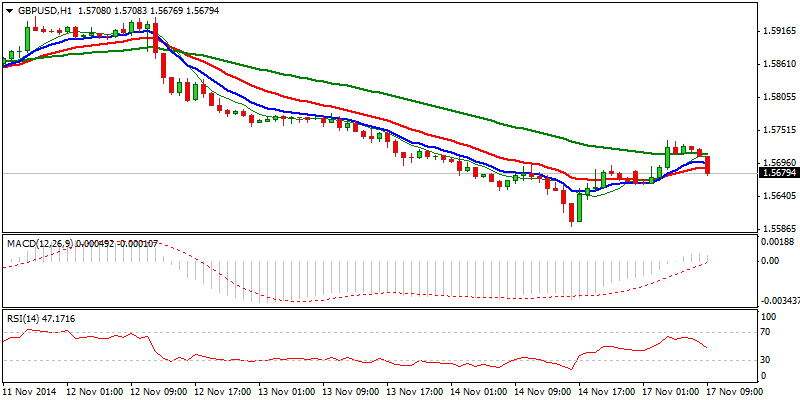
USDJPY
The pair corrects fresh strength which cracked psychological 117 barrier. Pullback was so far contained at 115.44, 50% of 113.84/117.03 upleg, with fresh attempts higher expected to follow, as bulls remain firmly in play on all timeframes. Sustained break above 117 barrier to open targets at 117.95, Oct 2007 peak and 120, psychological barrier, also Fibonacci 61.8% retracement of multi-year 147.68/75.55 descend. Near-term structure would weaken more significantly in case dips violate 115 zone, Fibonacci 61.8% / higher low of 12 Nov, which marks the last strong support on the way to pivotal 114 support zone.
Res: 116.00; 116.30; 116.81; 117.03
Sup: 115.44; 115.06; 114.88; 114.62 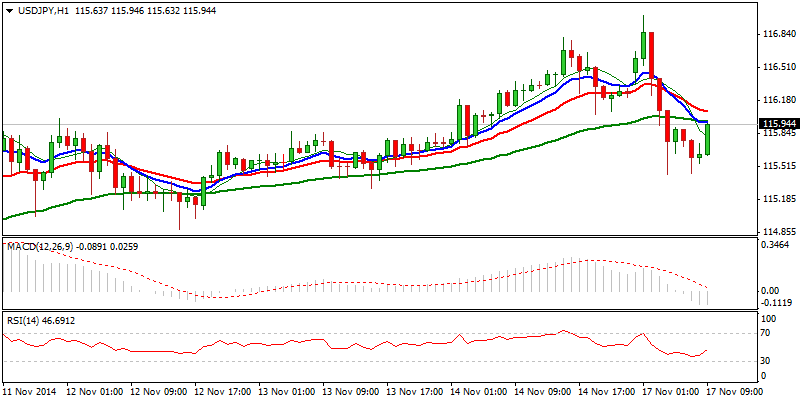
AUDUSD
The pair holds positive tone and hits levels close to psychological 0.88 barrier, after eventual break above pivotal 0.8760 lower platform. Last Friday’s positive close, with daily candle’s longer lower shadow, signaling fresh bulls, as weekly close also occurred in green. Sustained break above 0.88 barrier to resume bulls and look for the next strong barrier at pivotal 0.89 zone, lower platform. Corrective actions should find good support at 0.87 zone, Fibonacci 38.2% of 0.8539/0.8794 rally, with extended easing expected to be contained above 0.8646 higher low, to keep near-term up-trend from 0.8639 intact.
Res: 0.8794; 0.8822; 0.8850; 0.8880
Sup: 0.8744; 0.8700; 0.8670; 0.8650 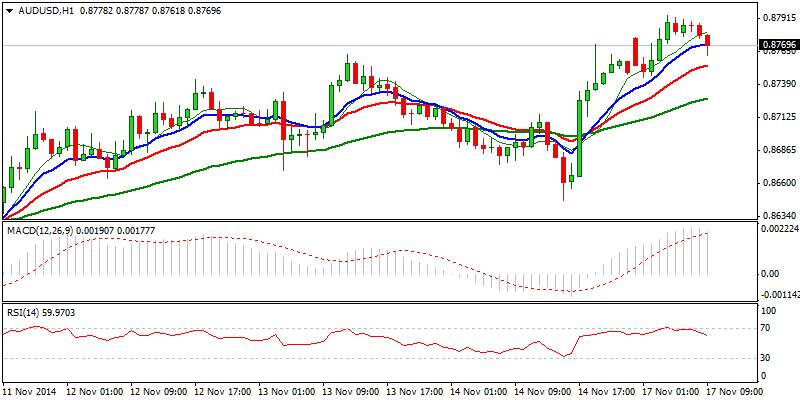
AUDNZD
The pair started the week in negative tone and opened with gap-lower, extending losses closer to psychological 1.10 support. Break below bull-trendline, connecting Sep-Oct lows, as well as crack of 100SMA, confirms bears for eventual push through key 1.10 support and 1.0980 higher base, below which short –term congestion low at 1.0920, is expected to come in near-term focus. Also more signals on triple-top confirmation would seen in case of sustained break lower. Near-term studies are negative, with daily indicators stabilizing below their midlines, support negative outlook, as the pair closed in red for the second consecutive week.
Res: 1.1043; 1.1070; 1.1081; 1.1100
Sup: 1.1000; 1.0980; 1.0950; 1.0920 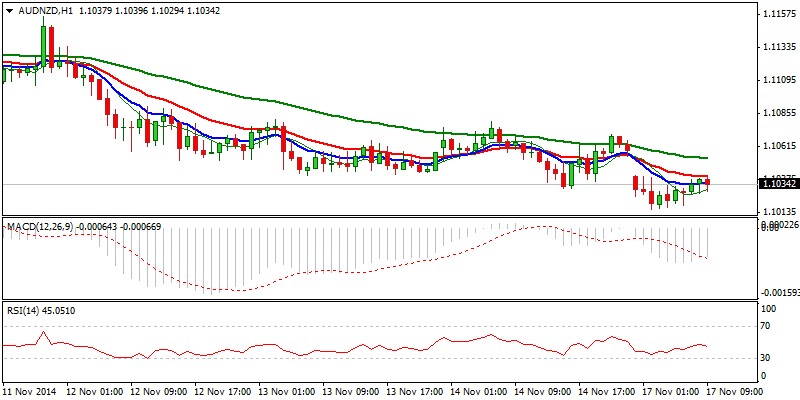
XAUUSD
Spot Gold rallied strongly on Friday, ending near-term consolidation phase, with extension through pivotal 1179/82 barrier, neutralizing near-term bears. Higher base was formed at 1145 zone and fresh rally so far peaked at the midpoint of 1255/1131descend , reinforced by daily Kijun-sen line and daily 20SMA, at 1193. Near-term bulls are firmly in play and look for psychological 1200 barrier. Consolidative action should be ideally contained at 1170/75 zone. However, overall structure remains negative and sees current rally as corrective, with regain of 1200 barrier and 1207, Fibonacci 61.8% of 1255/1131, required to sideline larger bears and allow for stronger recovery.
Res: 1193; 1200; 1207; 1216
Sup: 1182; 1175; 1170; 1165 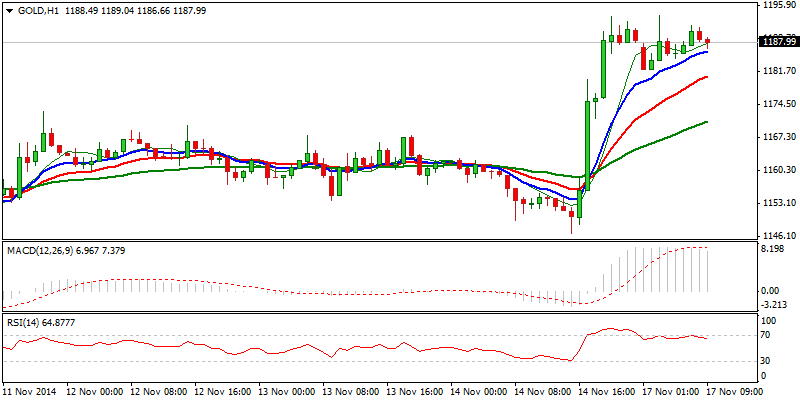
- English (UK)
- English (India)
- English (Canada)
- English (Australia)
- English (South Africa)
- English (Philippines)
- English (Nigeria)
- Deutsch
- Español (España)
- Español (México)
- Français
- Italiano
- Nederlands
- Português (Portugal)
- Polski
- Português (Brasil)
- Русский
- Türkçe
- العربية
- Ελληνικά
- Svenska
- Suomi
- עברית
- 日本語
- 한국어
- 简体中文
- 繁體中文
- Bahasa Indonesia
- Bahasa Melayu
- ไทย
- Tiếng Việt
- हिंदी
Daily Market Outlook: November 17, 2014
Published 11/17/2014, 04:45 AM
Updated 02/21/2017, 08:25 AM
Daily Market Outlook: November 17, 2014
Latest comments
Loading next article…
Install Our App
Risk Disclosure: Trading in financial instruments and/or cryptocurrencies involves high risks including the risk of losing some, or all, of your investment amount, and may not be suitable for all investors. Prices of cryptocurrencies are extremely volatile and may be affected by external factors such as financial, regulatory or political events. Trading on margin increases the financial risks.
Before deciding to trade in financial instrument or cryptocurrencies you should be fully informed of the risks and costs associated with trading the financial markets, carefully consider your investment objectives, level of experience, and risk appetite, and seek professional advice where needed.
Fusion Media would like to remind you that the data contained in this website is not necessarily real-time nor accurate. The data and prices on the website are not necessarily provided by any market or exchange, but may be provided by market makers, and so prices may not be accurate and may differ from the actual price at any given market, meaning prices are indicative and not appropriate for trading purposes. Fusion Media and any provider of the data contained in this website will not accept liability for any loss or damage as a result of your trading, or your reliance on the information contained within this website.
It is prohibited to use, store, reproduce, display, modify, transmit or distribute the data contained in this website without the explicit prior written permission of Fusion Media and/or the data provider. All intellectual property rights are reserved by the providers and/or the exchange providing the data contained in this website.
Fusion Media may be compensated by the advertisers that appear on the website, based on your interaction with the advertisements or advertisers.
© 2007-2025 - Fusion Media Limited. All Rights Reserved.
