EUR/USD
The euro started the week with gap-lower opening, as expected, according to the results of Greek elections, which increase pressure on the single currency, already weakened by recent SNB and ECB decisions. Lower opening of some 70-pips gap and fresh weakness below last Friday’s low, posted new low at 1.1096, on a brief probe below 1.11 handle. This was all seen so far, with fresh corrective action under way, on attempts above overnight’s high to fill the gap and signal stronger corrective action, ahead of fresh push lower. Overall picture holds strong bearish, confirmed by daily / weekly close in red, with last week’s descend, marking the strongest weekly fall since Sep 2010, also losses of the month of January are so far the strongest since May 2012. All these suggest that euro’s fall is not over, as the price closed for the week below Fibonacci 61.8% of larger 2000/2008 0.8225/1.6039 ascend, seeing scope for attack at psychological 1.10 level, as initial target. Bounce on oversold near-term studies is so far seen as corrective, with initial requirement of sustained break above 1.1200 barrier, to open lower top at 1.1287, ahead of more significant hourly lower platform at 1.1372, last Friday’s high / near 50% of 1.1679/1.1096 downleg. Key near-term barrier lies at 1.1660/80 Zone, lower platform of 19/21 Jan and Fibonacci 38.2% of 1.2568/1.1096 and only break here would neutralize bears.
Res: 1.1245; 1.1287; 1.1318; 1.1372
Sup: 1.1150; 1.1096; 1.1050; 1.1000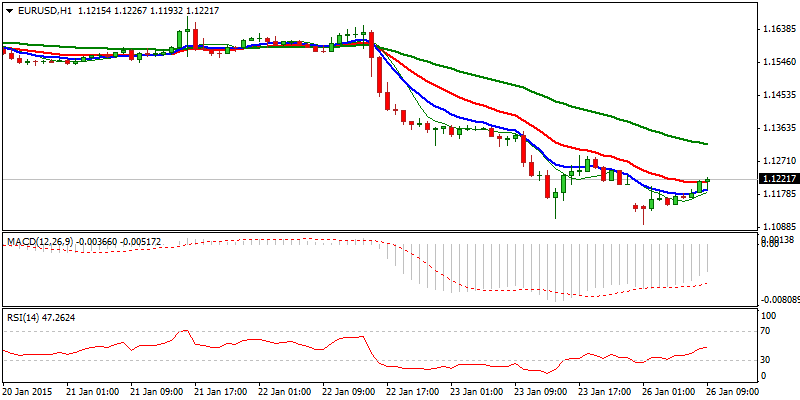
EUR/JPY
The pair bounces from fresh low at 130.13, signaling consolidative phase above psychological 130 support. Negative daily / weekly close, with the fourth consecutive weekly close in red and close below pivotal support at 134.12, low of 16 Oct 2014, confirm strong bearish stance, for further correction of larger 94.10/149.76 ascend. Near-term corrective rally, after filling overnight’s gap, focuses next strong barrier at 133 zone, lower top of last Friday and near Fibonacci 38.2% of 137.30/130.13 downleg, with sustained break higher to sideline near-term bears and allow for stronger corrective action, which is expected to be capped at 134.68, former hourly base and Fibonacci 61.8% retracement, before fresh attempt lower. Sustained break of 130 handle, could extend losses towards 128.50, Fibonacci 38.2% of 94.10/149.76 ascend.
Res: 133.00; 133.71; 134.20; 134.68
Sup: 131.13; 130.90; 130.13; 130.00 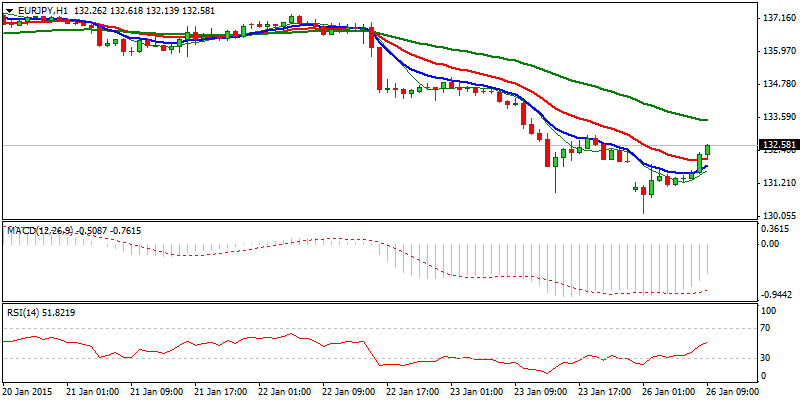
GBP/USD
Cable bounces from fresh low at 1.4950, posted on attempt below psychological 1.50 support, below which, last Friday’s close occurred. This gives signals of further bearish action towards initial target at 1.4910, Fibonacci 61.8% of 1.3501/1.7189 and more significant 1.4830/12 higher base and lows of 2013. Hesitation at 1.50 handle, above which near-term corrective bounce is trading, is expected to precede fresh leg lower, with 1.5050, previous low / Fibonacci 38.2% of 1.5210/1.4950, marking good barrier and 1.5110, Fibonacci 61.8% retracement, expected to ideally cap. Only break and close above 1.52 lower top and Fibonacci 38.2% of 1.5618/1.4950, would sideline near-term bears and open pivotal 1.5267 barrier, high of 14 Jan and former recovery attempts peak.
Res: 1.5050; 1.5080; 1.5110; 1.5150
Sup: 1.4983; 1.4950; 1.4910; 1.4830 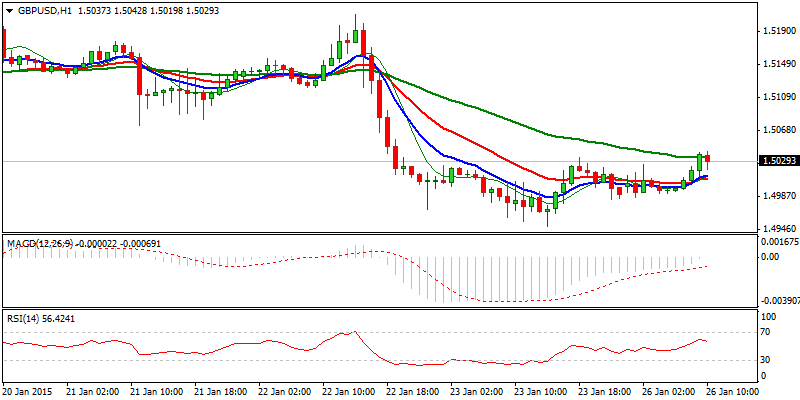
USD/JPY
The pair continues to trade in a choppy mode, entrenched within 117.20 and 118.85 range, with daily 20SMA / cloud, continuing to limit upside attempts. Last Friday’s close in red shows that the pair lacks strength for final push higher, however, mixed near-term and daily studies favor directionless mode in next few sessions, before establishing fresh direction. Sustained break above 118.85 is expected to accelerate rally towards next barriers at 120.00 and 120.80 in extension. Otherwise, loss of near-term range floor at 117.20, would increase risk of retesting 115.83, 16 Jan low and extension towards key short-term support at 115.55, low of 16 Dec 2014 and Fibonacci 38.2% of 105.18/121.83 rally.
Res: 118.32; 118.85; 119.30; 119.57
Sup: 117.82; 117.25; 116.90; 116.31 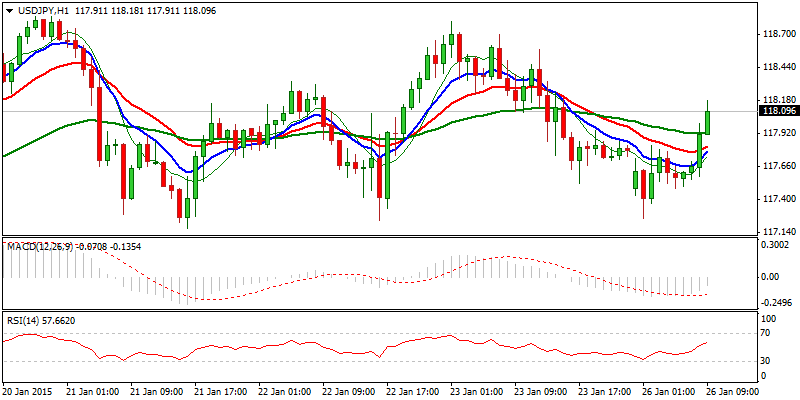
AUD/USD
The pair remains under pressure and posts fresh low at 0.7856, after last Friday’s acceleration lower closed below psychological 0.80 support, as well as 0.7945, Fibonacci 61.8% retracement of larger 0.6007/1.1079 ascend. Also, long red weekly candle, with weekly loss of that intensity, last time seen in Sep 2014, confirms negative stance for further retracement. Low of July 2009 at 0.7700 is seen as next near-term target, below which there will be no significant obstacles, until 0.7200, Fibonacci 76.4% retracement. Doji in Asian session and price action limited under session’s high, would signal limited upside, ahead of fresh attempts lower. Psychological 0.8000 resistance, also Fibonacci 38.2% of 0.8232/0.7856 descend and former lows at 0.8031, mark solid barrier and should ideally cap corrective attempts.
Res: 0.7945; 0.8000; 0.8031; 0.8088
Sup: 0.7856; 0.7800; 0.7750; 0.7700 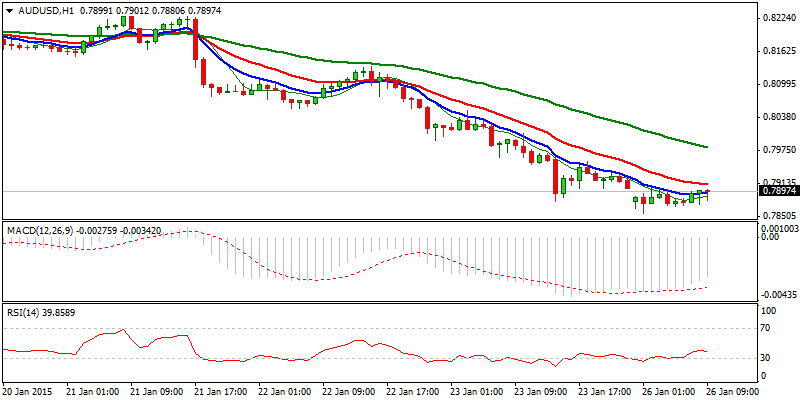
AUD/NZD
Near-term tone is turning negative, following last Friday’s fall that came after a double-Doji and repeated failure to close above descending daily 55SMA. Fresh weakness, which dipped to 1.0576, over 38.2% of 1.0350/1.0753 rally, was so far contained by daily 10 SMA, but seeing threats of further corrective action, which focuses next supports at 1.0552, daily Kijun-sen line and 1.0520, daily 20SMA, with close below here to confirm bearish structure. Conversely, formation of higher low, requires extension above 1.07 zone, last Friday’s high and daily 22SMA, to confirm bulls back in play for test of pivotal 1.0753 correction high and possible extension higher on a break.
Res: 1.0634; 1.0675; 1.0700; 1.0730
Sup: 1.0576; 1.0552; 1.0520; 1.0500 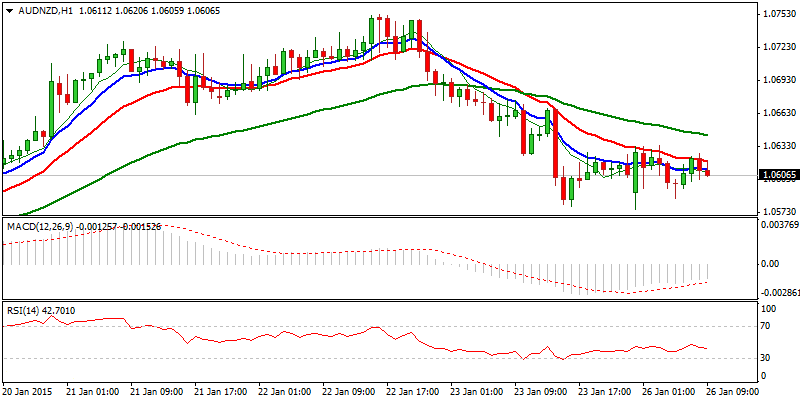
XAU/USD
Psychological 1300 level proves to be a strong barrier, as the price action is so far unable to clearly break above here and resume recovery. However, overall tone remains positive and price action underpinned by 10/200SMA’s golden cross, favoring fresh attempts higher after completion of prolonged near-term consolidative phase, with near-term focus at 1322/24, lower tops of 08 Aug / 17 July 2014. Corrective low of 22 Jan at 1279, is required to contain current action and keep bulls intact for renewed attack above 1300 barrier. Otherwise, extension lower to open daily 10SMA at 1274, below which to delay upside attempts, in favor of stronger correction.
Res: 1290; 1293; 1300; 1305
Sup: 1284; 1279; 1274; 1272 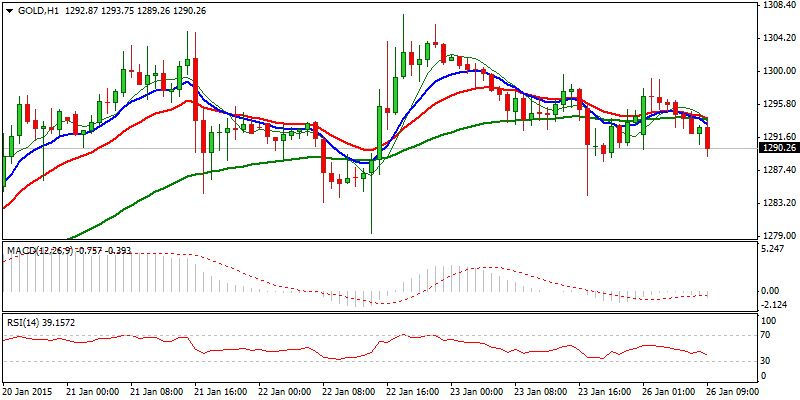
- English (UK)
- English (India)
- English (Canada)
- English (Australia)
- English (South Africa)
- English (Philippines)
- English (Nigeria)
- Deutsch
- Español (España)
- Español (México)
- Français
- Italiano
- Nederlands
- Português (Portugal)
- Polski
- Português (Brasil)
- Русский
- Türkçe
- العربية
- Ελληνικά
- Svenska
- Suomi
- עברית
- 日本語
- 한국어
- 简体中文
- 繁體中文
- Bahasa Indonesia
- Bahasa Melayu
- ไทย
- Tiếng Việt
- हिंदी
Daily Market Outlook: January 26, 2015
Published 01/26/2015, 04:12 AM
Updated 02/21/2017, 08:25 AM
Daily Market Outlook: January 26, 2015
Latest comments
Loading next article…
Install Our App
Risk Disclosure: Trading in financial instruments and/or cryptocurrencies involves high risks including the risk of losing some, or all, of your investment amount, and may not be suitable for all investors. Prices of cryptocurrencies are extremely volatile and may be affected by external factors such as financial, regulatory or political events. Trading on margin increases the financial risks.
Before deciding to trade in financial instrument or cryptocurrencies you should be fully informed of the risks and costs associated with trading the financial markets, carefully consider your investment objectives, level of experience, and risk appetite, and seek professional advice where needed.
Fusion Media would like to remind you that the data contained in this website is not necessarily real-time nor accurate. The data and prices on the website are not necessarily provided by any market or exchange, but may be provided by market makers, and so prices may not be accurate and may differ from the actual price at any given market, meaning prices are indicative and not appropriate for trading purposes. Fusion Media and any provider of the data contained in this website will not accept liability for any loss or damage as a result of your trading, or your reliance on the information contained within this website.
It is prohibited to use, store, reproduce, display, modify, transmit or distribute the data contained in this website without the explicit prior written permission of Fusion Media and/or the data provider. All intellectual property rights are reserved by the providers and/or the exchange providing the data contained in this website.
Fusion Media may be compensated by the advertisers that appear on the website, based on your interaction with the advertisements or advertisers.
© 2007-2025 - Fusion Media Limited. All Rights Reserved.
