EURUSD
The Euro lacked strength to extend near-term recovery attempt from 1.2357 low, as probe above 1.25 barrier was short-lived and capped by descending daily 10SMA, under pivotal 1.2532 lower top. Yesterday’s close in red, with candle’s longer upper shadow, signals renewed downside pressure. Pullback from recovery high at 1.2507, dipped to 1.2414, Fibonacci 61.8% of 1.2357/1.2507 upleg, where temporary support was found. Overall tone is negative, with near-term bears coming in play after yesterday’s upside rejection, with loss of 1.24 handle, seen as the last step on completion 1.2357/1.2507 corrective phase. On the other side, daily RSI/MACD bullish divergence, keeps hopes of fresh recovery attempts, with clearance of 1.2507/32 barriers, required as initial signal of stronger recovery.
Res: 1.2500; 1.2532; 1.2565; 1.2576
Sup: 1.2414; 1.2400; 1.2377; 1.2357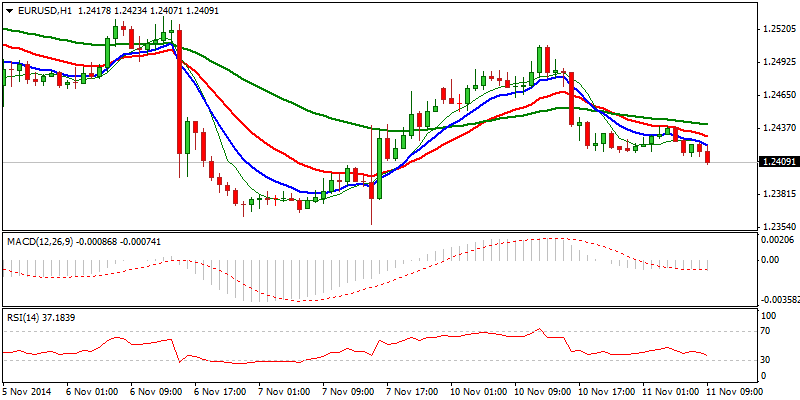
EURJPY
The pair remains in near-term consolidative phase, after reversal from fresh high at 144.20, was contained above important 142 support. Subsequent bounce, which pushed the price above the mid-point of 144.20/142.08 range, sidelines downside risk, with bulls coming in play on hourly chart, indicating further ascend. Yesterday’s Hammer supports the notion. Clearance of 143.58, lower top of 06 Nov, is required to expose 144.20, above which, final push towards key 145.67, 27 Dec 2013 peak, would be expected, as daily structure remains firm and weekly bulls are coming fully in play.
Res: 143.58; 143.80; 144.00; 144.20
Sup: 143.00; 142.80; 142.53; 142.08 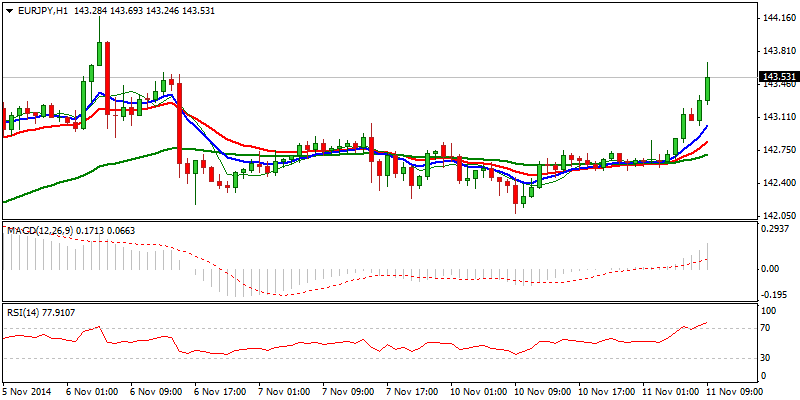
GBPUSD
Cable came under pressure after failure to sustain break above 1.59 barrier, 50% of 1.6020/1.5788 downleg and subsequent pullback so far retraced 61.8% of 1.5788/1.5915 recovery rally. Near-term focus shifts lower and brief consolidation above fresh lows at 1.5835, is likely to precede final push for full retracement of 1.5788/1.5915 corrective rally, as overall bears are looking for the next targets at 1.5750/20, June 2013 high / Fibonacci 61.8% of 1.4812/1.7189, 2013 low / 2014 high, ascend. Alternatively, renewed strength through 1.59 barrier would sideline immediate downside risk, while clearance of 1.6020 lower platform and breakpoint zone, is required to neutralize near-term bears.
Res: 1.5870; 1.5915; 1.5953; 1.6000
Sup: 1.5835; 1.5814; 1.5788; 1.5750 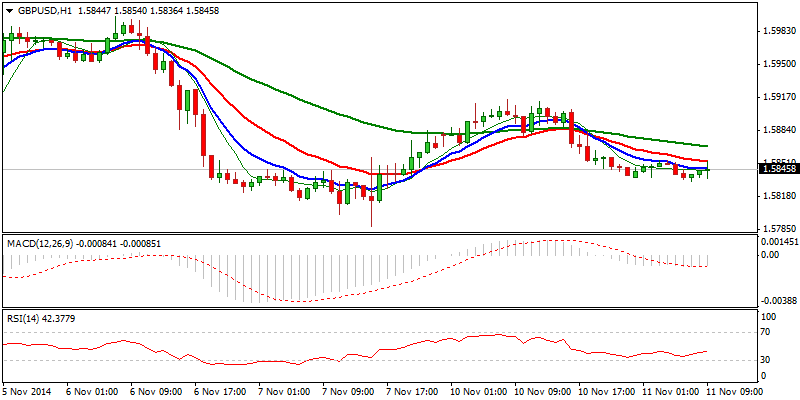
USDJPY
The pair returns to strength after false break below pivotal 114 support and subsequent bounce, which nearly fully retraced 115.56/113.84 corrective pullback, neutralized downside risk. Reversal was signaled by yesterday’s bullish Hammer, with fresh strength expected to target 117.95, Oct 2007 high and 120.12, Fibonacci 61.8% of long-term 147.68/75.55 descend. Initial supports lay at 115.00/114.90 and 114.62, with key 114 support zone, marking near-term breakpoint.
Res: 115.50; 116.00; 116.21; 116.62
Sup: 115.12; 114.90; 114.62; 114.25 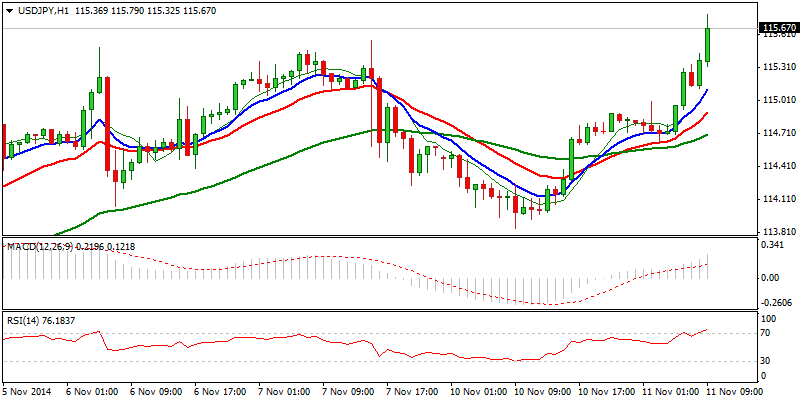
AUDUSD
Corrective bounce off fresh low at 0.8539 was capped at strong double-Fibonacci barrier at 0.8680 zone, 38.2% of 0.8909/0.8539 descend and 61.8% retracement of 0.8760/0.8539 downleg, reinforced by 4-hour 55EMA. Fresh easing sidelined near-term upside attempts, but so far holds above psychological 0.86 support, also near 50% of 0.8539/0.8680 upleg. Weak near-term studies do not see much of upside potential for now, as overall bears are fully in play and look for break of temporary low at 0.8540, 50% of long-term 0.6007/1.1079 ascend, to open0.8460, bear-trendline, connecting 2008 peak and 0.8658, 24 Jan 2014 low. On the other side, daily MACD bullish divergence supports, indicates stronger correction in the near-term. Break of initial 0.8680 barrier and 0.8760 lower platform, is required to revive bulls and sideline immediate downside risk.
Res: 0.8649; 0.8680; 0.8700; 0.8760
Sup: 0.8600; 0.8565; 0.8539; 0.8500 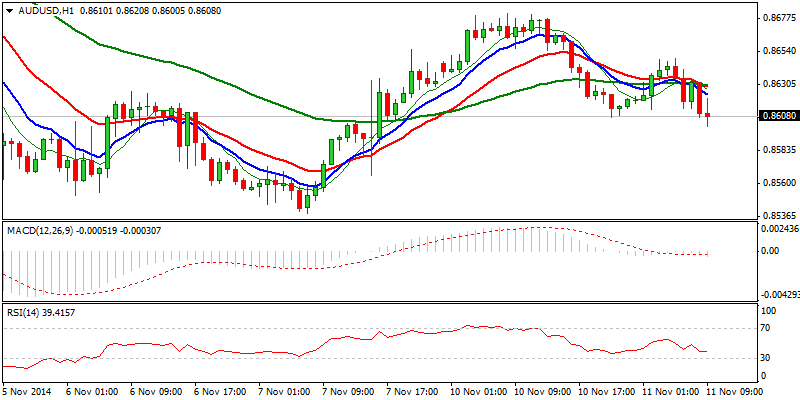
AUD/NZD
The pair showed no significant changes in past few session, continuing to trade in near-term consolidative mode, after cracking important 1.1100 level, psychological support / Fibonacci 61.8% of 1.0983/1.1301 upleg. Yesterday’s Doji confirms near-term directionless mode. Bounce from fresh low at 1.1088, so far holds below initial 1.1170/80 barrier, Fibonacci 38.2% of 1.1301/1.1088 / lower platform, signaling possible fresh weakness, as near-term studies are negative. Sustained break below 1.11 handle, also daily cloud top, to open way for further easing and signal triple-top formation on 1.13 zone. Fibonacci 38.2% of 1.0619/1.1301 ascend at 1.1040, offers the next support, ahead of psychological 1.10 level, also 100SMA and higher base at 1.0980. Alternative scenario requires break and close above 1.12 barrier, near mid-point of 1.1301/1.1088 downleg, to sideline downside risk.
Res: 1.1150; 1.1170; 1.1182; 1.1200
Sup: 1.1100; 1.1088; 1.1040; 1.1000 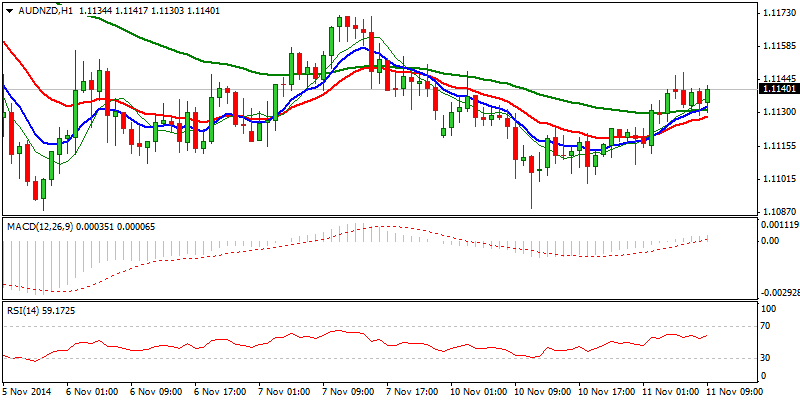
XAUUSD
Spot Gold lost traction and dipped to 1145 so far, erasing over 61.8% of 1131/1179 corrective rally, on acceleration from 1179 top. Weakened near-term structure sees increased downside risk, which was signaled by yesterday’s long red candle, following double-rejection at 1179, on 07 and 10 Nov, where rally was capped by descending daily 10SMA and Tenkan-sen line. Corrective upside attempts see strong barrier at 1158, Fibonacci 38.2% of 1179/1145 downleg, reinforced by hourly 20/55EMA’s bear-cross and extended rallies should be capped under 1166, Fibonacci 61.8% retracement, before eventual completion of 1131/1179 corrective phase. Alternative scenario requires bullish action above 1166 and 1179, to sideline near-term bears and open way for further correction of 1255/1131 descend.
Res: 1158; 1166; 1179; 1182
Sup: 1145; 1142; 1137; 1131 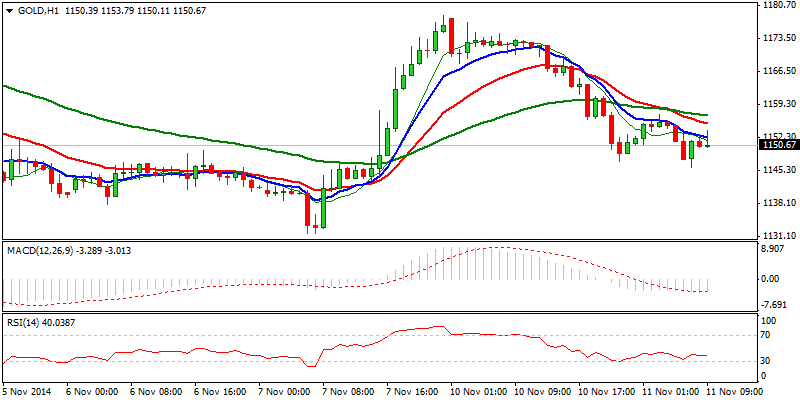
- English (UK)
- English (India)
- English (Canada)
- English (Australia)
- English (South Africa)
- English (Philippines)
- English (Nigeria)
- Deutsch
- Español (España)
- Español (México)
- Français
- Italiano
- Nederlands
- Português (Portugal)
- Polski
- Português (Brasil)
- Русский
- Türkçe
- العربية
- Ελληνικά
- Svenska
- Suomi
- עברית
- 日本語
- 한국어
- 简体中文
- 繁體中文
- Bahasa Indonesia
- Bahasa Melayu
- ไทย
- Tiếng Việt
- हिंदी
Daily Market Outlook: Euro Lacks Strength
Published 11/11/2014, 05:57 AM
Updated 02/21/2017, 08:25 AM
Daily Market Outlook: Euro Lacks Strength
Latest comments
Loading next article…
Install Our App
Risk Disclosure: Trading in financial instruments and/or cryptocurrencies involves high risks including the risk of losing some, or all, of your investment amount, and may not be suitable for all investors. Prices of cryptocurrencies are extremely volatile and may be affected by external factors such as financial, regulatory or political events. Trading on margin increases the financial risks.
Before deciding to trade in financial instrument or cryptocurrencies you should be fully informed of the risks and costs associated with trading the financial markets, carefully consider your investment objectives, level of experience, and risk appetite, and seek professional advice where needed.
Fusion Media would like to remind you that the data contained in this website is not necessarily real-time nor accurate. The data and prices on the website are not necessarily provided by any market or exchange, but may be provided by market makers, and so prices may not be accurate and may differ from the actual price at any given market, meaning prices are indicative and not appropriate for trading purposes. Fusion Media and any provider of the data contained in this website will not accept liability for any loss or damage as a result of your trading, or your reliance on the information contained within this website.
It is prohibited to use, store, reproduce, display, modify, transmit or distribute the data contained in this website without the explicit prior written permission of Fusion Media and/or the data provider. All intellectual property rights are reserved by the providers and/or the exchange providing the data contained in this website.
Fusion Media may be compensated by the advertisers that appear on the website, based on your interaction with the advertisements or advertisers.
© 2007-2025 - Fusion Media Limited. All Rights Reserved.
