EURUSD
The Euro remains bearish and commences fresh phase lower, after completion of 1.2244/1.2568 correction, posting new lows at 1.2218. Last Friday’s close in red and below previous low, confirms bearish stance, with weekly bearish engulfing, signaling further acceleration lower in the short-term. Break below psychological 1.22 support, to open 1.2120/00, Fibonacci 138.2% projection of the downleg from 1.2598 / bull-trendline off 2005 low at 1.1640 and pivotal 1.2042, low of July 2012. Consolidative action is expected to precede fresh weakness, with first barrier at 1.23 zone, hourly lower platform / Fibonacci 23.6% of 1.2568/1.2219 downleg, ahead of 1.2352, 38.2% retracement / 18 Dec lower top and 1.2387, descending daily 20SMA, which is expected to cap extended corrective rallies. However, caution is required, as bullish divergence on daily MACD, continues to appear and close above daily 20SMA, would sideline bears and signal stronger recovery action.
Res: 1.2300; 1.2352; 1.2387; 1.2435
Sup: 1.2218, 1.2200; 1.2125; 1.2100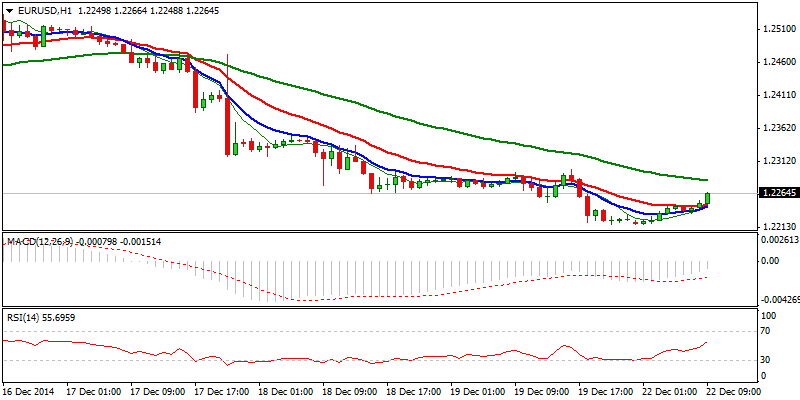
EURJPY
The pair trades within narrowing range, with upside being capped under 146.90, daily Tenkan-sen/Kijun-sen bear cross, which gives negative signal. Neutral/negative near-term structure sees increased downside risk, while price action stays capped under 146.90/147. Fresh weakness below 146 support, to signal completion of 4-hour bearish flag and re-attract key 144.94 low, for resumption of pullback from 149.76 peak. Conversely, lift above 147 zone barriers, also requires close above 147.20, daily 20SMA, to confirm bullish resumption of corrective rally from 144.94 low and trigger further retracement of 179.76/144.94 downleg.
Res: 146.76; 146.90; 147.00; 147.20
Sup: 146.00; 145.58; 145.34; 144.94 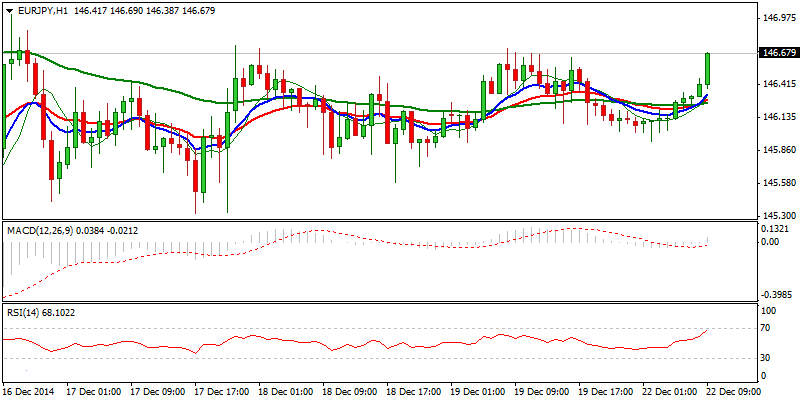
GBPUSD
Cable trades above short-term range lows, which were retested on last-week’s acceleration lower. However, downside risk remains in play, as recovery attempts were so far capped at 1.5680, where daily 20SMA and Kijun-sen line, mark solid resistance. The notion is also supported by negative daily /weekly close, which maintains overall negative picture and sees risk of retesting 1.5540 base and resumption of larger downtrend on a break. Alternative scenario requires sustained break above 1.5680/90, recovery peak / Fibonacci 61.8% of 1.5783/1.5542, to sideline downside risk and move the price into upper part of short-term range.
Res: 1.5680; 1.5690; 1.5755; 1.5783
Sup: 1.5603; 1.5540; 1.5500; 1.5450 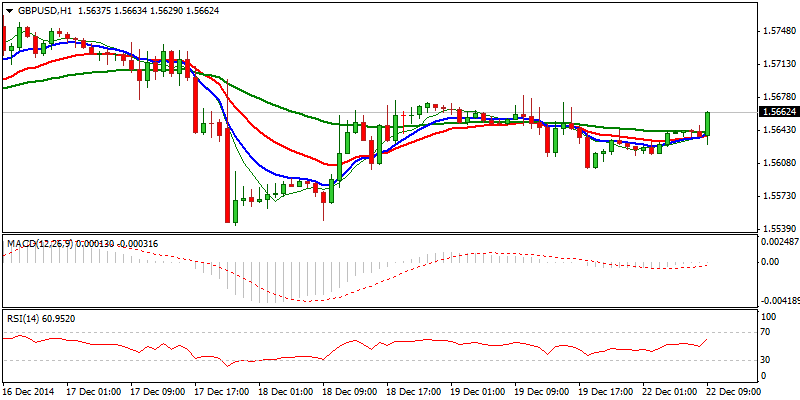
USDJPY
The pair remains positive in the near-term and consolidates after cracking pivotal 119.43/54 barriers, Fibonacci 61.8% retracement of 121.83/115.55 / 11 Dec lower top Break here is required to signal resumption of recovery phase from fresh low at 115.55. The notion is supported by positive near-term studies, also positive last Friday’s close and price action being underpinned by ascending daily 20SMA. Initial supports lay at 118.85/65, ahead of higher low at 118.24 and Fibonacci 38.2% retracement of 115.55/119.61 ascend at 118.06, where dips should be ideally contained.
Res: 119.61; 120.00; 120.35; 121.00
Sup: 119.00; 118.85; 118.65; 118.24 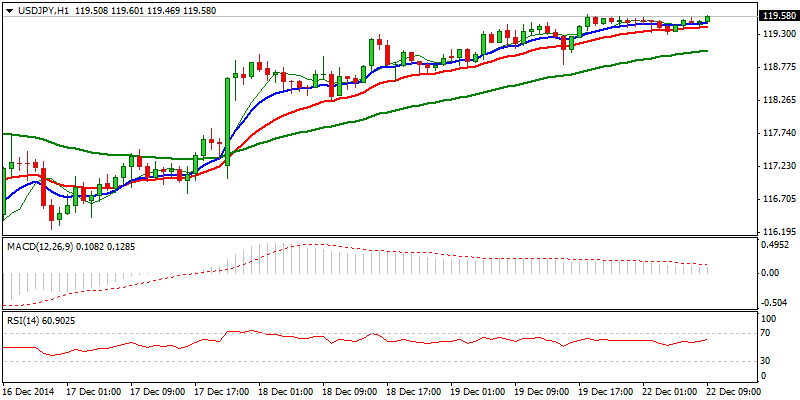
AUDUSD
The pair remains in consolidation phase above fresh low at 0.8105, posted on 17 Dec, with corrective attempts being so far capped by 0.8200, previous base, now initial resistance. Last Friday’s and weekly close in red, signal fresh weakness ahead, with limited upside action. Completion of daily bearish pennant, to extend the third wave from 0.8794, towards its 200% Fibonacci expansion at 0.8033 and psychological 0.8000 support. Prolonged corrective action requires extension above 0.82 barrier and daily Tenkan-sen line at 0.8239, to further delay bears for test of psychological 0.8300, then 0.8329, descending daily 20SMA and 0.8373, 11Dec lower top.
Res: 0.8185; 0.8200; 0.8234; 0.8272
Sup: 0.8120; 0.8105; 0.8033; 0.8000 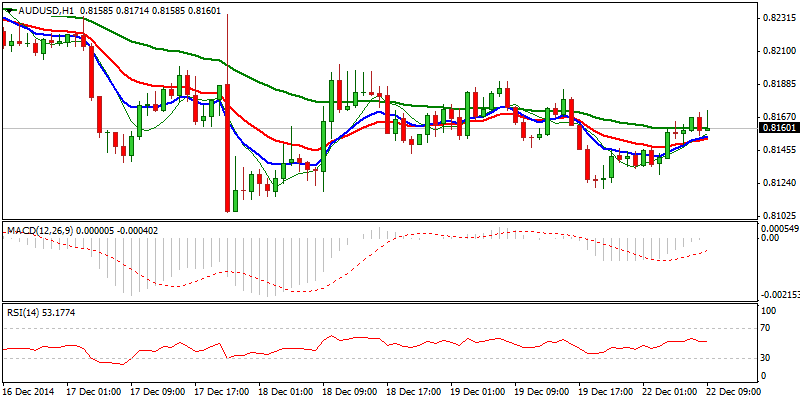
AUD/NZD
The pair hesitates further, after cracking critical supports at 1.05/1.04 zone. Last Friday’s Doji candle confirms near-term indecision and suggests prolonged consolidative phase, before fresh attempts lower. Overall bearish picture and weekly close in red confirm strong bearish stance, however, oversold daily studies may delay bears. Descending daily 10SMA, offers initial barrier at 1.0580, ahead of lower top at 1.0646 and pivotal 1.0706/17, daily 20SMA / Fibonacci 61.8% retracement of 1.0864/1.0479 downleg, close above which to sideline bears.
Res: 1.0580; 1.0646; 1.0706; 1.0717
Sup: 1.0517; 1.0479; 1.0432; 1.0400 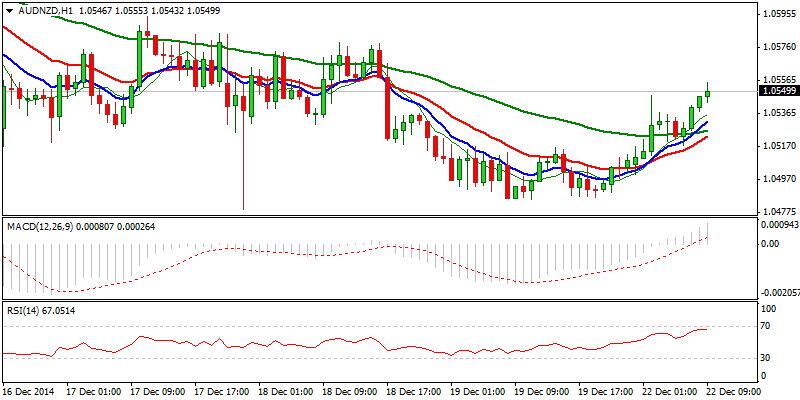
XAUUSD
Spot gold remains directionless in the near-term and continues to trade in consolidative phase above fresh low at 1183. The upside attempts were so far capped by daily 20SMA and holding below daily cloud top, with last Friday’s close in red, signaling lack of momentum for eventual clearance of initial 1200 resistance zone. Also, negative weekly close supports the notion of fresh attempts lower, with initial support at 1193 and fresh low of 17 Dec at 1183, being in focus. Conversely, clearance of 1200 barrier to ease downside pressure, with close above 12010, daily Tenkan-sen line, required to neutralize bears.
Res: 1200; 1204; 1210; 1217
Sup: 1193; 1187; 1183; 1179 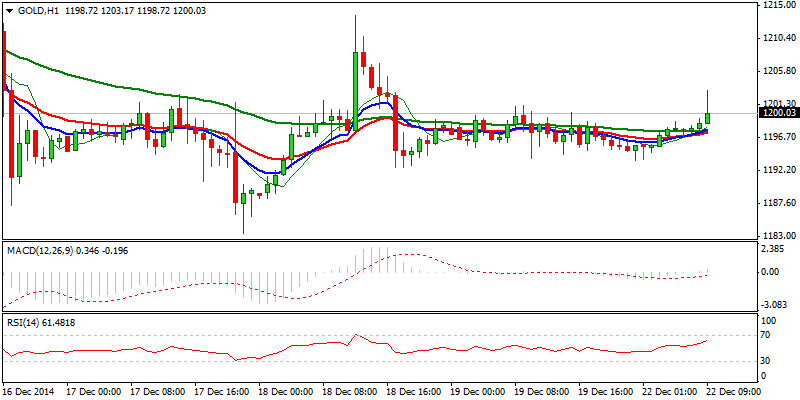
- English (UK)
- English (India)
- English (Canada)
- English (Australia)
- English (South Africa)
- English (Philippines)
- English (Nigeria)
- Deutsch
- Español (España)
- Español (México)
- Français
- Italiano
- Nederlands
- Português (Portugal)
- Polski
- Português (Brasil)
- Русский
- Türkçe
- العربية
- Ελληνικά
- Svenska
- Suomi
- עברית
- 日本語
- 한국어
- 简体中文
- 繁體中文
- Bahasa Indonesia
- Bahasa Melayu
- ไทย
- Tiếng Việt
- हिंदी
Daily Market Outlook: December 22, 2014
Published 12/22/2014, 05:45 AM
Updated 02/21/2017, 08:25 AM
Daily Market Outlook: December 22, 2014
Latest comments
Loading next article…
Install Our App
Risk Disclosure: Trading in financial instruments and/or cryptocurrencies involves high risks including the risk of losing some, or all, of your investment amount, and may not be suitable for all investors. Prices of cryptocurrencies are extremely volatile and may be affected by external factors such as financial, regulatory or political events. Trading on margin increases the financial risks.
Before deciding to trade in financial instrument or cryptocurrencies you should be fully informed of the risks and costs associated with trading the financial markets, carefully consider your investment objectives, level of experience, and risk appetite, and seek professional advice where needed.
Fusion Media would like to remind you that the data contained in this website is not necessarily real-time nor accurate. The data and prices on the website are not necessarily provided by any market or exchange, but may be provided by market makers, and so prices may not be accurate and may differ from the actual price at any given market, meaning prices are indicative and not appropriate for trading purposes. Fusion Media and any provider of the data contained in this website will not accept liability for any loss or damage as a result of your trading, or your reliance on the information contained within this website.
It is prohibited to use, store, reproduce, display, modify, transmit or distribute the data contained in this website without the explicit prior written permission of Fusion Media and/or the data provider. All intellectual property rights are reserved by the providers and/or the exchange providing the data contained in this website.
Fusion Media may be compensated by the advertisers that appear on the website, based on your interaction with the advertisements or advertisers.
© 2007-2025 - Fusion Media Limited. All Rights Reserved.
