EUR/USD
Yesterday’s strong acceleration higher that left long green daily candle and closed well above 1.1034/50 breakpoint, confirms strong bullish tone. Confirmation of daily double-bottom pattern opens way for further retracement of larger 1.1449/1.0461 descend, as the pair closed above its Fibonacci 61.8% retracement at 1.1071. Yesterday’s rally probed above daily cloud top at 1.1165 and approached psychological 1.12 barrier, also Fibonacci 161.8% expansion of the third wave from 1.0664. The wave could travel to 1.1252 and 1.1330 in extension, levels that mark Fibonacci 176.4% and 200$ expansion, respectively. The pair is poised for the first positive monthly close, after nine consecutive closes in red that supports scenario of stronger recovery. Corrective phase on overbought near-term studies is under way, with former pivotal barriers at 1.1050/34, also Fibonacci 38.2% retracement of 1.0818/1.1186 upleg, now marking good support and seen as ideal reversal point. On the other side, extended correction is expected to hold above 1.0958, hourly higher base and Fibonacci 61.8% retracement of 1.0818/1.1186, loss of which would sideline near-term bulls.
Res: 1.1124; 1.1186; 1.1200; 1.1252
Sup: 1.1075; 1.1034; 1.1000; 1.0948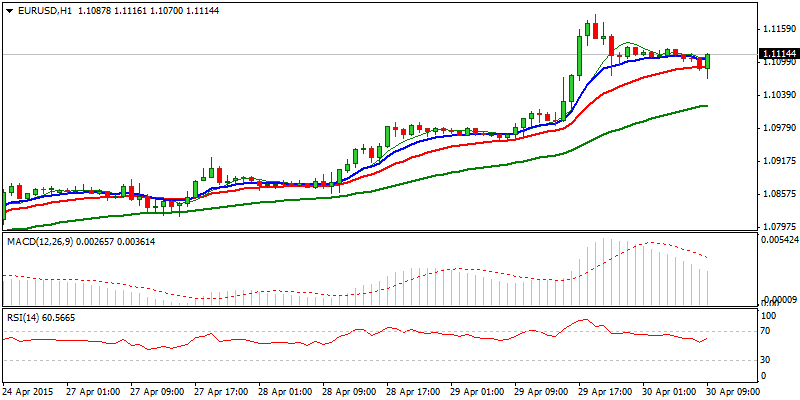
EUR/JPY
The cross approached 133 barrier on acceleration yesterday that broke and close above pivotal 131.50 platform, consolidation tops of end of Mar/beginning of Apr. Yesterday’s acceleration probed above Fibonacci 61.8% retracement of 136.68/126.08 descend at 132.62 and peaked at 132.88, leaving long green daily candle. Pullback on overbought near-term studies, probes former breakpoint at 131.50, with next support at 130.80, Fibonacci 38.2% of 127.44/132.88 upleg and psychological 130 support, expected to contain. Otherwise, near-term bulls would be sidelined on extended corrective action.
Res: 132.00; 132.53; 132.87; 133.26
Sup: 131.00; 130.80; 130.00; 129.52 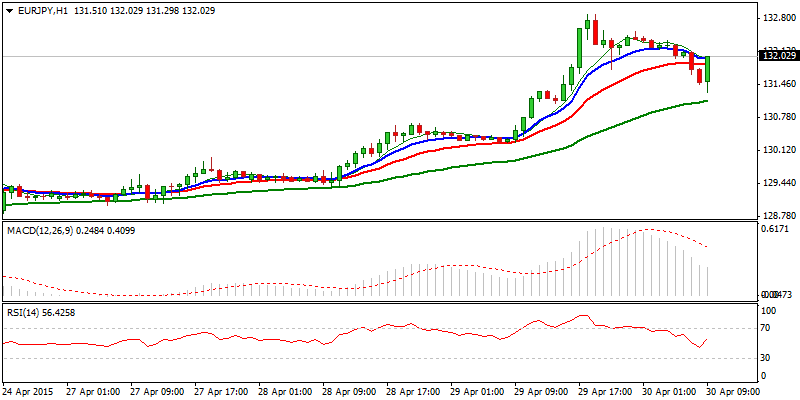
GBP/USD
Cable remains in unobstructed rally off 1.4563, 13 Apr low that peaked at ticks away of psychological 1.55 barrier, on yesterday’s fresh acceleration. The seventh consecutive positive daily close, favors eventual attack at key barrier at 1.5551, 26 Feb peak, to complete 1.5551/1.4563 bear-leg and signal stronger recovery of larger 1.7189/1.4563 descend, as 1.5551 barrier also lies near Fibonacci 38.2% retracement of 1.7189/1.4563 downmove. The pair is poised for positive monthly close, shaped in bullish engulfing candle that supports reversal scenario. Corrective easing is expected to precede final attempts at key 1.5551 barrier, with initial support laying at 1.5345, yesterday’s higher low, ahead of 1.5250, Fibonacci 38.2% retracement of 1.4854/1.5496 rally and 1.5175 trough, mid-point of 1.4854/1.5496, reinforced by daily 100SMA, where extended dips should find footstep.
Res: 1.5443; 1.5496; 1.5530; 1.5551
Sup: 1.5345; 1.5300; 1.5250; 1.5175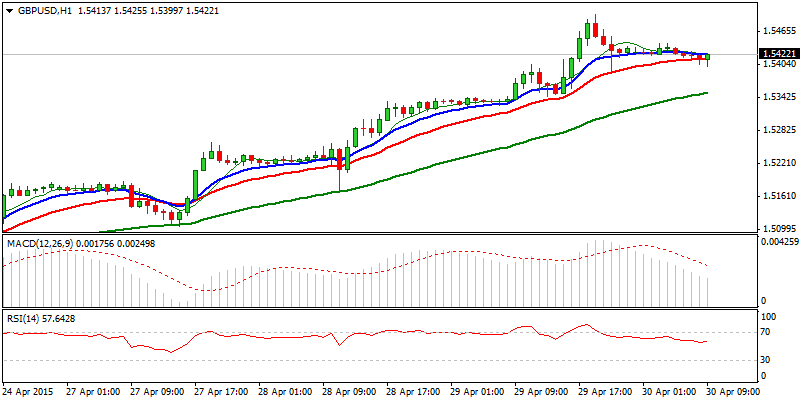
USD/JPY
The pair comes under pressure today and probes again below 119 handle, where yesterday’s bumpy ride, entrenched within 118.59/119.35 range, closed. Overall picture remains negative, as bearish setup of daily studies and expanding daily 20d Bollinger bands, suggest eventual break below pivotal 118.31 support, low of 26 Mar, to confirm an end of short-term range-trading phase and resume descend from 122.01. Bearish near-term studies support the notion. Daily cloud base at 118.92, offers immediate resistance, ahead of session high at 119.15, reinforced by daily 10SMA, ahead of yesterday’s peak at 119.35 and pivotal daily 20SMA at 119.43, close above which to neutralize immediate downside risk.
Res: 118.92; 119.15; 119.35; 119.43
Sup: 118.48; 118.31; 118.00; 117.50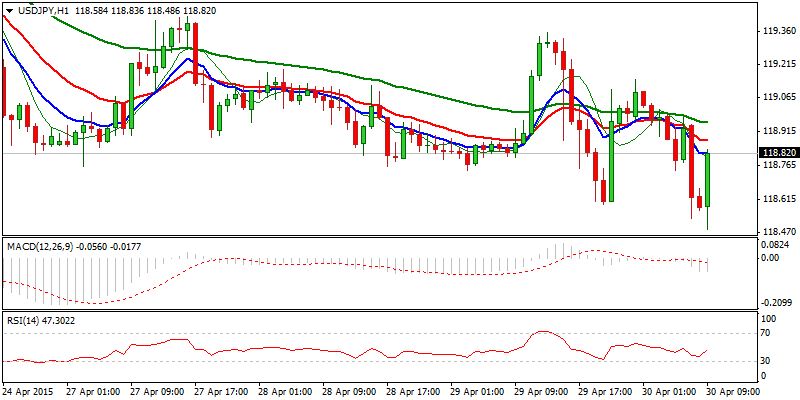
AUD/USD
The pair extends near-term corrective phase and reverses below psychological 0.80 support, following yesterday’s close in red after peaking at 0.8073, with long upper shadow of the daily candle, signaling increased selling pressure. Hourly studies are losing traction, as the pair probes below 0.7975, yesterday’s low. Next supports lay at 0.7936/23, former breakpoint / Fibonacci 38.2% retracement of 0.7681/0.8073 upleg / daily Ichimoku cloud top, where dips should be ideally contained. Otherwise, extended pullback would delay near-term bulls.
Res: 0.8000; 0.8026; 0.8073; 0.8100
Sup: 0.7936; 0.7926; 0.7877; 0.7841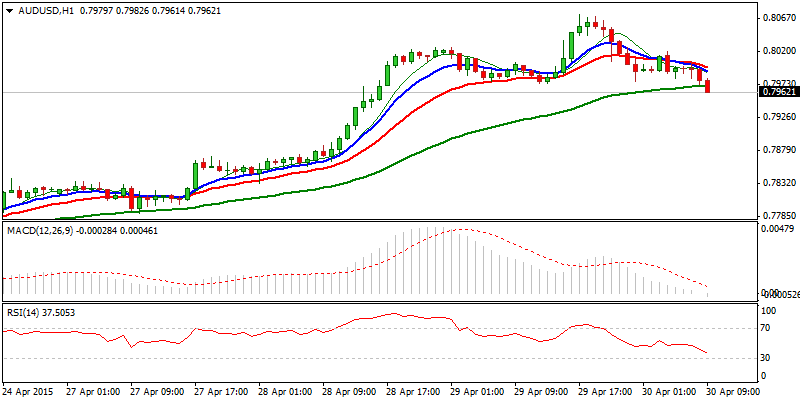
AUD/NZD
The cross continued to move higher today, after yesterday’s consolidation phase, shaped in long-legged Doji candle. Fresh strength cracked psychological 1.05 barrier, also Fibonacci 61.8% retracement of 1.0792/1.0016 and daily Ichimoku cloud top and approaches key barrier at 1.0526, peak of 11 Mar. Completion of 1.0526/1.0016 bear-phase is required to confirm daily double-bottom, formed just above parity level and signal further retracement of larger 1.0792/1.0016 descend. The pair is poised for positive monthly close, with monthly bullish engulfing pattern forming and supporting the notion.
Res: 1.0516; 1.0526; 1.0573; 1.0609
Sup: 1.0475; 1.0435; 1.0389; 1.0357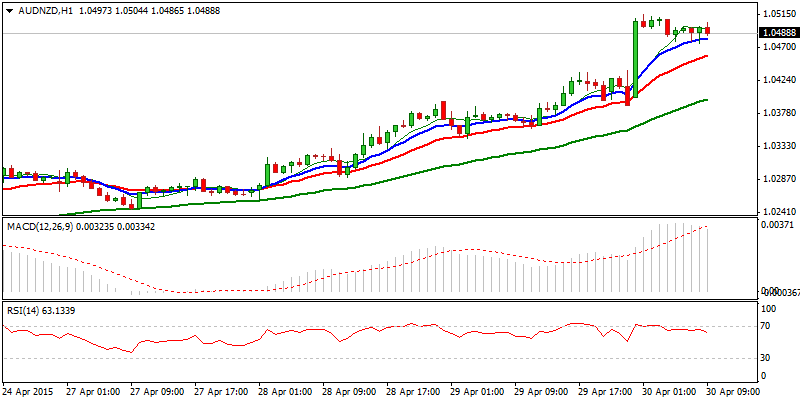
XAU/USD
Spot Gold eases from fresh recovery high at 1214, where recovery rally towards key 1224 barrier, ran out of steam. Fresh weakness so far holds above psychological 1200 support, reinforced by daily 20SMA and marking breakpoint, however, yesterday’s bearish Inside Day, signals increasing downside pressure. Conflicting near-term technicals show negative tone on hourlies and bulls persisting on 4-hour studies, suggest prolonged consolidation phase, before establishing fresh direction. Contracting daily 20d Bollinger bands support the notion. Break below 1200 support, would be an initial signal of further easing, while penetration of fresh recovery high of 28 Apr at 1215, would bring bulls back to play, for eventual attack at 1224 breakpoint, 06 Apr peak, daily Ichimoku cloud top / daily 200SMA.
Res: 1206; 1213; 1215; 1224
Sup: 1200; 1195; 1190; 1184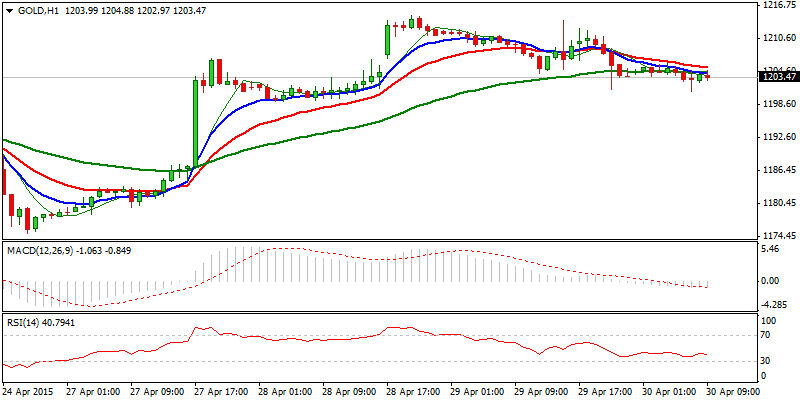
- English (UK)
- English (India)
- English (Canada)
- English (Australia)
- English (South Africa)
- English (Philippines)
- English (Nigeria)
- Deutsch
- Español (España)
- Español (México)
- Français
- Italiano
- Nederlands
- Português (Portugal)
- Polski
- Português (Brasil)
- Русский
- Türkçe
- العربية
- Ελληνικά
- Svenska
- Suomi
- עברית
- 日本語
- 한국어
- 简体中文
- 繁體中文
- Bahasa Indonesia
- Bahasa Melayu
- ไทย
- Tiếng Việt
- हिंदी
Thursday's Daily Market Outlook: EUR/USD, EUR/JPY, GBP/USD, USD/JPY
Published 04/30/2015, 07:58 AM
Updated 02/21/2017, 08:25 AM
Thursday's Daily Market Outlook: EUR/USD, EUR/JPY, GBP/USD, USD/JPY
Latest comments
Loading next article…
Install Our App
Risk Disclosure: Trading in financial instruments and/or cryptocurrencies involves high risks including the risk of losing some, or all, of your investment amount, and may not be suitable for all investors. Prices of cryptocurrencies are extremely volatile and may be affected by external factors such as financial, regulatory or political events. Trading on margin increases the financial risks.
Before deciding to trade in financial instrument or cryptocurrencies you should be fully informed of the risks and costs associated with trading the financial markets, carefully consider your investment objectives, level of experience, and risk appetite, and seek professional advice where needed.
Fusion Media would like to remind you that the data contained in this website is not necessarily real-time nor accurate. The data and prices on the website are not necessarily provided by any market or exchange, but may be provided by market makers, and so prices may not be accurate and may differ from the actual price at any given market, meaning prices are indicative and not appropriate for trading purposes. Fusion Media and any provider of the data contained in this website will not accept liability for any loss or damage as a result of your trading, or your reliance on the information contained within this website.
It is prohibited to use, store, reproduce, display, modify, transmit or distribute the data contained in this website without the explicit prior written permission of Fusion Media and/or the data provider. All intellectual property rights are reserved by the providers and/or the exchange providing the data contained in this website.
Fusion Media may be compensated by the advertisers that appear on the website, based on your interaction with the advertisements or advertisers.
© 2007-2025 - Fusion Media Limited. All Rights Reserved.
