EUR/USD
The euro holds within consolidative range for almost one month, after hitting 12-year low at 1.1096 and subsequent corrective rally was capped at 1.1532. The price remains entrenched within narrowed range of 1.1280/1.1450, with neutral near-term technicals and flat daily 10/20SMA’s / Tenkan-sen line and contracting 20d Bollingers, favoring further sideways trade. Initial support and range floor at 1.1280, guards more significant 1.1260 higher base and Fibonacci 61.8% retracement of 1.1096/1.1532 rally, loss of which is required to revive bears and signal acceleration of larger picture’s downtrend towards key 1.1096 support. Alternatively, violation of the range top at 1.1450 to expose pivotal 1.1532 barrier, for possible extended corrective action.
Res: 1.1387; 1.1400; 1.1428; 1.1450
Sup: 1.1334; 1.1300; 1.1287; 1.1260 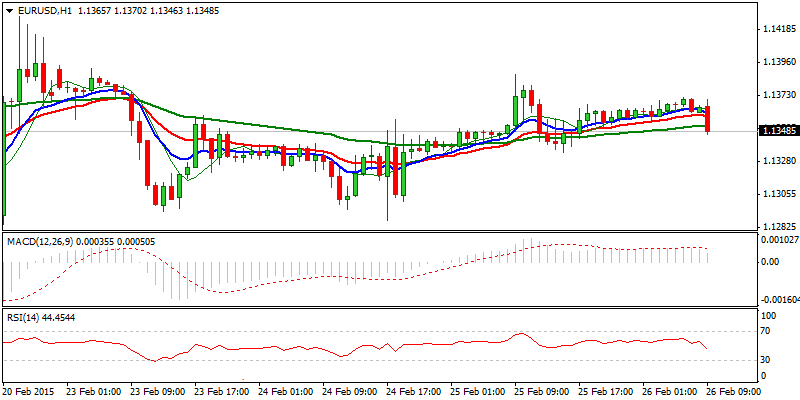
EUR/JPY
The cross remains in range trading, after yesterday’ price action moved within limited range and ended in Doji candle. With price hovering around 135 handle, no direction is seen in the near-term, while daily 20SMA / Tenkan-sen line, currently at 134.80zone, remain intact and initial barriers 135.90 cap. Neutral near-term studies and contracting 20d Bollingers support the notion.
Res: 135.58; 135.90; 136.22; 136.68
Sup: 135.00; 134.80; 134.50; 133.92 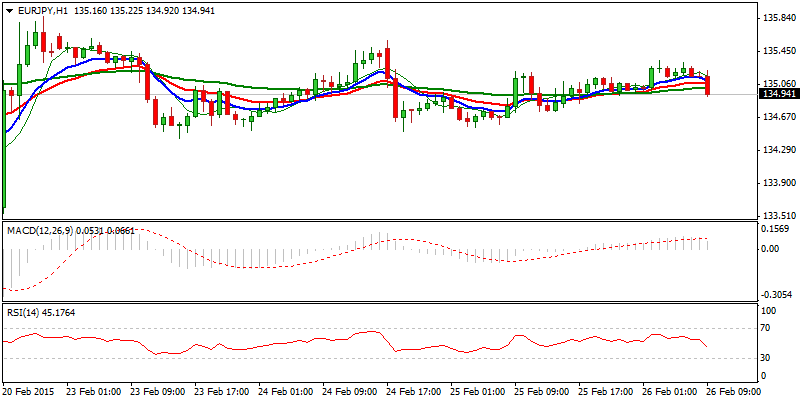
GBP/USD
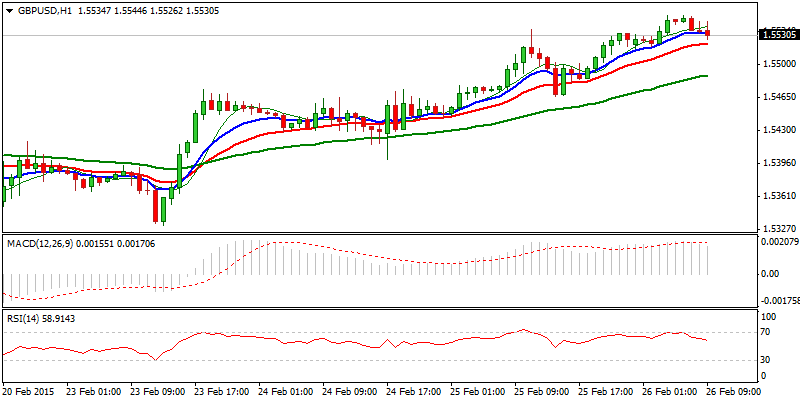
Cable remains supported and extends rally, after break and close above daily Ichimoku cloud top. Yesterday’s long green candle signals strong bullish tone, with price action approaching daily 100SMA at 1.5576, en-route towards pivotal 1.5618 lower top of 31 Dec 2014. Strong bullish setup of daily technicals, favors further upside, with rising 10SMA and Tenkan-sen line underpinning the action. Also, north-heading near-term indicators are supportive, however, 1 and 4-hour RSI approaching overbought territory, would signal hesitation on approach to 1.5618 barrier. Corrective easing should be ideally contained at 1.5470 zone, 25 Feb trough and previous highs of 23/24 Feb, to keep bulls intact.
Res: 1.5551; 1.5576; 1.5585; 1.5618
Sup: 1.5518; 1.5500; 1.5470; 1.5430
USD/JPY
The pair remains in near-term directionless mode, following false break above 119.40 barrier, consolidating around 119 handle. Tone of near-term studies remains neutral, as well as daily picture that shows price entrenched between sideways-moving Kijun-sen and Tenkan-sen lines, which mark initial support / resistance at 118.66 and 119.00. Support is also reinforced by ascending daily 20SMA and break here to expose pivotal support at 118.25, higher base and daily Ichimoku cloud top. On the upside, sustained break above 119.00 is required to shift focus higher, for renewed attempt through pivotal 119.40 barrier, break of which to signal resumption of recovery leg from 118.25 and open barriers at 120.00 and 120.46.
Res: 119.08; 119.40; 119.82; 120.00
Sup: 118.78; 118.61; 118.25; 118.00 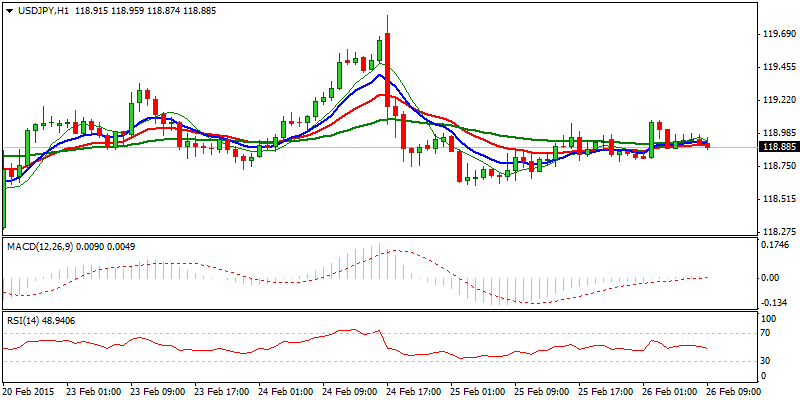
AUD/USD
The pair enters corrective phase under fresh high at 0.7900, posted yesterday, where descending daily Kijun-sen line capped the acceleration. Reversal found temporary support at 0.7840 zone, near Fibonacci 38.2% retracement of 0.7738/0.7899 rally, where dips should be ideally contained for fresh attempts higher, after the price broke and close above pivotal 0.7874, 06 Feb former high. Rising daily Tenkan-sen at 0.7820, reinforces support area and holding above here is needed to keep focus at the upside targets at 0.7900 and 0.8000/23. Alternative scenario sees fresh weakness through 0.7840/20 zone and extension below 0.7800, psychological / double-Fibonacci support, reinforced by daily 20SMA, as bearish signal that would sideline near-term bulls and mark false break higher.
Res: 0.7870; 0.7900; 0.7950; 0.8000
Sup: 0.7837; 0.7820; 0.7800; 0.7756 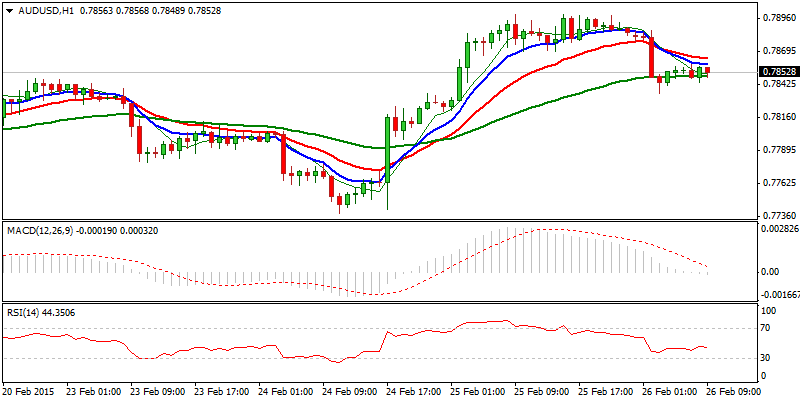
AUD/NZD
The pair lost traction and retraced nearly 61.8% of corrective rally from fresh low at 1.0296 that peaked at 1.0472. Initial bullish tone faded after recovery rally was capped by descending daily 20SMA and fresh acceleration below daily Tenkan-sen line, weakened near-term technicals. Weak tone sees risk of attack at pivotal 1.0350 higher base, loss of which to signal an end of corrective phase and formation of lower top at 1.0472, as overall tone remains bearish.
Res: 1.0400; 1.0424; 1.0464; 1.0472
Sup: 1.0368; 1.0350; 1.0327; 1.0296 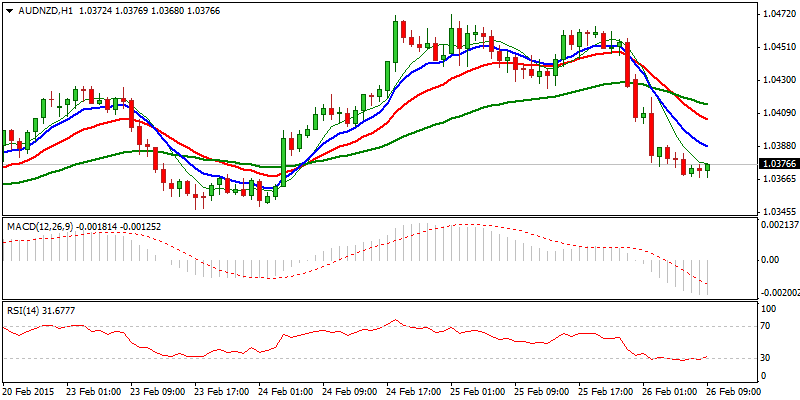
XAU/USD
Near-term corrective attempts were capped by descending daily 10SMA at 1211 and yesterday’s close just above 1200 support, left inverted Hammer candle. Today’s renewed attempts higher, cracked descending daily 10SMA, with break and close above here and sideways –moving daily Tenkan-sen line at 1213, required to maintain positive near-term tone and open way for further recovery. Next barrier lies at 1216, former low and daily 100SMA, above which the price may accelerate towards 1230, descending daily 20SMA. On the other side, repeated upside rejection would signal prolonged consolidative phase, with downside expected to remain vulnerable.
Res: 1213; 1216; 1222; 1230
Sup: 1204; 1201; 1197; 1190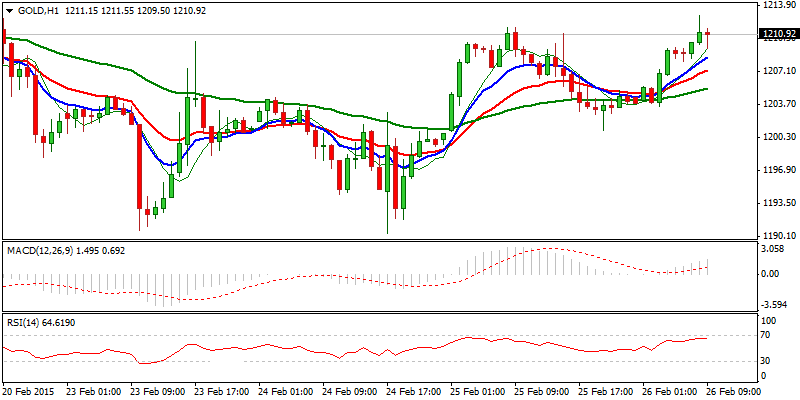
- English (UK)
- English (India)
- English (Canada)
- English (Australia)
- English (South Africa)
- English (Philippines)
- English (Nigeria)
- Deutsch
- Español (España)
- Español (México)
- Français
- Italiano
- Nederlands
- Português (Portugal)
- Polski
- Português (Brasil)
- Русский
- Türkçe
- العربية
- Ελληνικά
- Svenska
- Suomi
- עברית
- 日本語
- 한국어
- 简体中文
- 繁體中文
- Bahasa Indonesia
- Bahasa Melayu
- ไทย
- Tiếng Việt
- हिंदी
Daily Market Outlook: EUR/USD, EUR/JPY,GBP/USD
Published 02/26/2015, 04:43 AM
Updated 02/21/2017, 08:25 AM
Daily Market Outlook: EUR/USD, EUR/JPY,GBP/USD
Latest comments
Loading next article…
Install Our App
Risk Disclosure: Trading in financial instruments and/or cryptocurrencies involves high risks including the risk of losing some, or all, of your investment amount, and may not be suitable for all investors. Prices of cryptocurrencies are extremely volatile and may be affected by external factors such as financial, regulatory or political events. Trading on margin increases the financial risks.
Before deciding to trade in financial instrument or cryptocurrencies you should be fully informed of the risks and costs associated with trading the financial markets, carefully consider your investment objectives, level of experience, and risk appetite, and seek professional advice where needed.
Fusion Media would like to remind you that the data contained in this website is not necessarily real-time nor accurate. The data and prices on the website are not necessarily provided by any market or exchange, but may be provided by market makers, and so prices may not be accurate and may differ from the actual price at any given market, meaning prices are indicative and not appropriate for trading purposes. Fusion Media and any provider of the data contained in this website will not accept liability for any loss or damage as a result of your trading, or your reliance on the information contained within this website.
It is prohibited to use, store, reproduce, display, modify, transmit or distribute the data contained in this website without the explicit prior written permission of Fusion Media and/or the data provider. All intellectual property rights are reserved by the providers and/or the exchange providing the data contained in this website.
Fusion Media may be compensated by the advertisers that appear on the website, based on your interaction with the advertisements or advertisers.
© 2007-2025 - Fusion Media Limited. All Rights Reserved.
