EUR/USD
Yesterday’s Doji confirms near-term neutral mode, with price action being entrenched within 1.1268/1.1358 range. Daily 10SMA continues to cap, keeping the downside vulnerable, as 4-hour studies remain negatively aligned. End of consolidative phase and break below 1.1260 base, reinforced by Fibonacci 61.8% retracement of 1.1096/1.1532 upleg, to resume descend from 1.1532, 03 Feb correction high. Immediate targets at 1.1222, higher low of 27 Jan and 1.1199, Fibonacci 76.4% retracement, are expected to come in near-term focus and return to key support at 1.1096, low of 26 Jan, seen on further acceleration lower. Alternatively, lift above 10SMA, currently at 1.1350, to open next layer of dynamic barriers, daily 20SMA / Tenkan-sen at 1.14 zone, close above which to provide relief.
Res: 1.1330; 1.1358; 1.1380; 1.1400
Sup: 1.1300; 1.1268; 1.1260; 1.1222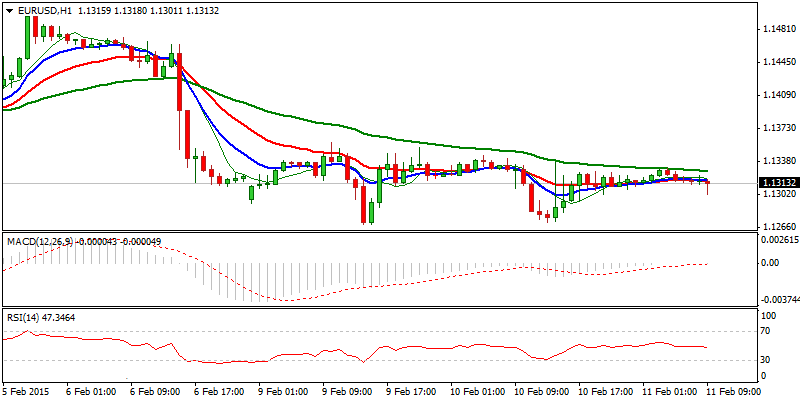
EUR/JPY
Yesterday’s fresh strength that closed above daily 20SMA and cracked near-term congestion tops at 135.35, gives initial signals of fresh recovery extension. Confirmation of bullish scenario requires close above 135.35 lower platform, to open next target at 137.63, Fibonacci 38.2% of 149.76/130.13 descend and lower top of 20 Jan, above which, acceleration towards 200SMA, currently at 139.50, could be expected. Failure to clear 135.35 barrier, however, would signal prolonged consolidation, with loss of ascending daily 10SMA, expected to weaken near-term tone.
Res: 135.46; 135.80; 136.00; 136.43
Sup: 135.15; 134.77; 134.15; 133.66 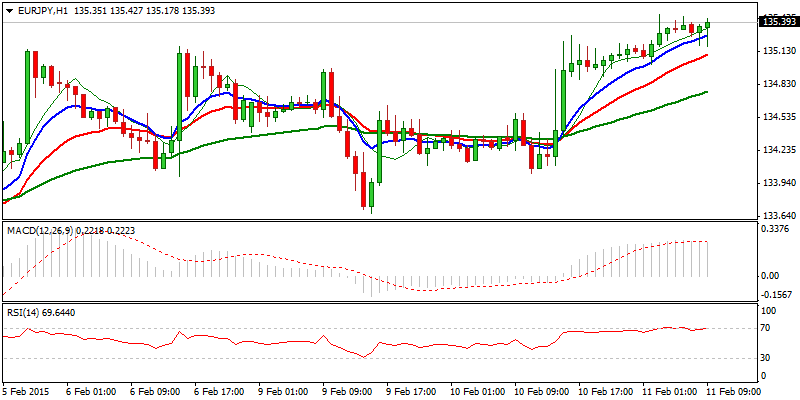
GBP/USD
Cable remains in consolidative phase 1.52 handle, near double- Fibonacci support, 38.2% retracement of 1.4950/1.5351 upleg and broken 38.2% of 1.5618/1.4950 descend, where pullback from fresh correction high at 1.5351, found temporary footstep. Near-term studies are positively aligned, but lacking momentum for more significant upside attempts, with range tops at 1.5275, remaining intact for now. This suggests further consolidation, with loss of 1.52 handle, expected to weaken the structure and open daily 10 SMA at 1.5176 and 20SMA at 1.5143, loss of which to weaken the tone further and re-focus lower boundaries of former consolidation range. Alternatively, sustained break above consolidation tops at 1.5275 would improve and signal of higher base formation, for return towards pivotal 1.5351 high. Bullish resumption requires confirmation on a break above 1.5386, falling daily 55SMA.
Res: 1.5275; 1.5300; 1.5351; 1.5386
Sup: 1.5200; 1.5164; 1.5126; 1.5095 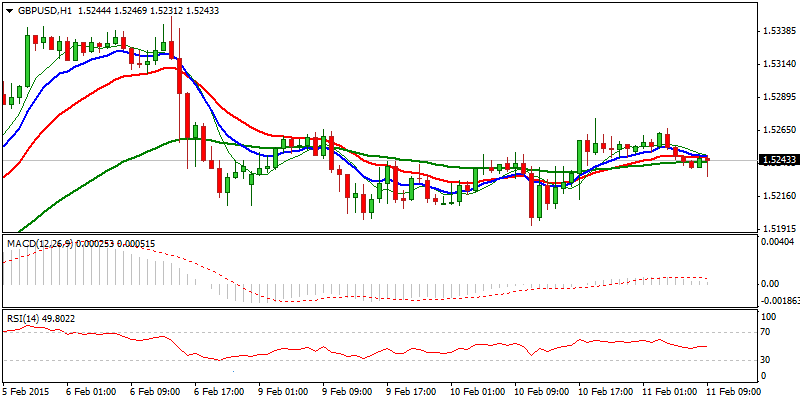
USD/JPY
The pair eventually broke above daily cloud top that capped the upside attempts for past three weeks, giving initial signal of bullish resumption of recovery from 115.83 higher low of 16 Jan. The third wave that commenced from 116.86 trough, faces immediate barrier at 119.74, Fibonacci 100% expansion, above which to open lower top at 119.95 and could extend to 120.80 lower platform, also Fibonacci 138.2% expansion. Initial support lies at 119.20, previous high of 06 Feb, with extended corrective easing, expected to be contained above 118.70, daily 55SMA, to keep bulls in play.
Res: 119.74; 119.95; 120.80; 121.00
Sup: 119.20; 118.70; 118.31; 118.00 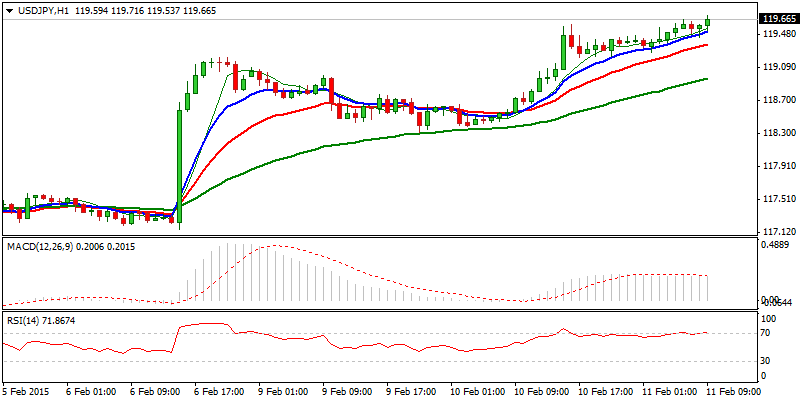
AUD/USD
The pair remains in near-term range, holding between 0.7732 and 0.7874 boundaries, with descending daily 10SMA limiting the upside. Near-term studies are weakening, as the price returns to the lower side of the range and see risk of break below range floor, to signal an end of consolidative phase and re-focus fresh low at 0.7624, posted on 03 Feb, as overall picture remains bearish. Alternative scenario requires break above range tops and daily 20SMA, currently at 0.7918, to provide near-term relief and open way for further correction.
Res: 0.7840; 0.7874; 0.7900; 0.7940
Sup: 0.7746; 0.7732; 0.7720; 0.7660 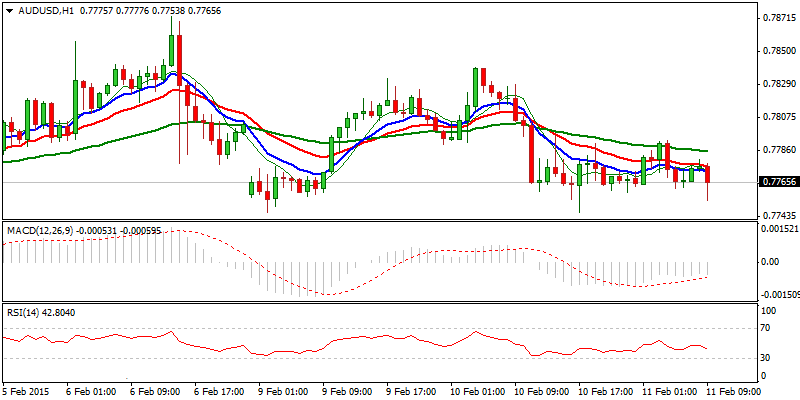
AUD/NZD
The pair continues to move lower after losing 1.05 handle and tested 1.0454, Fibonacci 76.4% retracement of 1.0350/1.0791 corrective rally, so far. Bearish tone dominates on lower timeframes studies, keeping the downside in focus, with daily indicators establishing in negative territory and MA’s in descending mode and forming bear-cross of 10/20SMA’s at 1.06 zone, where fresh leg lower has commenced. Scope is seen for further weakness and return to key support at 1.0350, 07 Jan fresh multi-year low and resumption of larger downtrend. Corrective rallies should be capped under 1.06 barrier, to keep bears intact.
Res: 1.0500; 1.0545; 1.0573; 1.0609
Sup: 1.0454; 1.0418; 1.0372; 1.0350 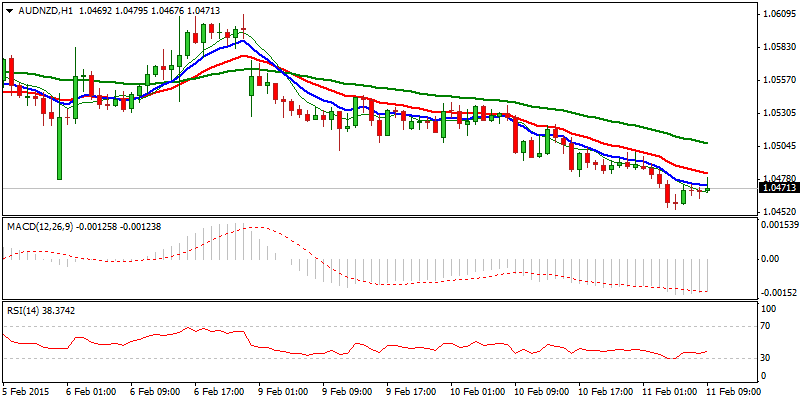
XAU/USD
Spot Gold trades in near-term consolidative phase above fresh low at 1228, with upside attempts being so far capped under double-Fibonacci barrier at 1447, 50% retracement of 1266/1228 and 23.6% of larger 1307/1228 descend, which is expected to ideally limit rallies and keep pivotal 1252, 200SMA and former base, intact. Neutral mode is seen while the price holds within the range, however negative setup of near-term studies keeps the downside vulnerable. Renewed attempt at 1228 and break lower, to signal resumption of the downtrend from 1307 and open 1220, Fibonacci 61.8% of 1167/1307 and daily 100SMA at 1216. Alternative scenario requires, close above pivotal 1253 barrier, to neutralize bears.
Res: 1240; 1245; 1247; 1253
Sup: 1230; 1228; 1220; 1216 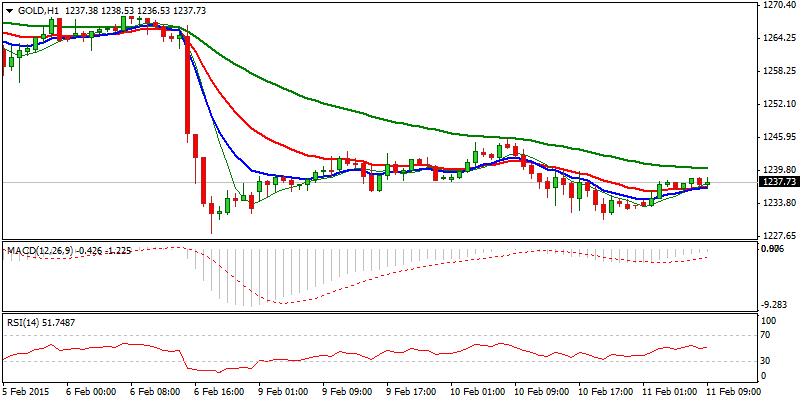
- English (UK)
- English (India)
- English (Canada)
- English (Australia)
- English (South Africa)
- English (Philippines)
- English (Nigeria)
- Deutsch
- Español (España)
- Español (México)
- Français
- Italiano
- Nederlands
- Português (Portugal)
- Polski
- Português (Brasil)
- Русский
- Türkçe
- العربية
- Ελληνικά
- Svenska
- Suomi
- עברית
- 日本語
- 한국어
- 简体中文
- 繁體中文
- Bahasa Indonesia
- Bahasa Melayu
- ไทย
- Tiếng Việt
- हिंदी
Daily Market Outlook: EUR/USD, EUR/JPY, GBP/USD
Published 02/11/2015, 03:43 AM
Updated 02/21/2017, 08:25 AM
Daily Market Outlook: EUR/USD, EUR/JPY, GBP/USD
Latest comments
Loading next article…
Install Our App
Risk Disclosure: Trading in financial instruments and/or cryptocurrencies involves high risks including the risk of losing some, or all, of your investment amount, and may not be suitable for all investors. Prices of cryptocurrencies are extremely volatile and may be affected by external factors such as financial, regulatory or political events. Trading on margin increases the financial risks.
Before deciding to trade in financial instrument or cryptocurrencies you should be fully informed of the risks and costs associated with trading the financial markets, carefully consider your investment objectives, level of experience, and risk appetite, and seek professional advice where needed.
Fusion Media would like to remind you that the data contained in this website is not necessarily real-time nor accurate. The data and prices on the website are not necessarily provided by any market or exchange, but may be provided by market makers, and so prices may not be accurate and may differ from the actual price at any given market, meaning prices are indicative and not appropriate for trading purposes. Fusion Media and any provider of the data contained in this website will not accept liability for any loss or damage as a result of your trading, or your reliance on the information contained within this website.
It is prohibited to use, store, reproduce, display, modify, transmit or distribute the data contained in this website without the explicit prior written permission of Fusion Media and/or the data provider. All intellectual property rights are reserved by the providers and/or the exchange providing the data contained in this website.
Fusion Media may be compensated by the advertisers that appear on the website, based on your interaction with the advertisements or advertisers.
© 2007-2025 - Fusion Media Limited. All Rights Reserved.
