EUR/USD
The Euro resumes pullback off 1.1288, after losing initial 1.1173 support, 01 May low and today’s probe below psychological 1.11 support. Overall bullish structure sees the pullback as corrective action, of near-term strong acceleration higher. However, weaker tone of near-term studies, favors further easing. The pair eyes next layers of supports 1.1109/1.1070, 38.2% of 1.0818/1.1288 rally and hourly higher base, below which, extended dips should ideally find ground at 1.10 zone, daily 10SMA and double-Fibonacci support, 38.2% of larger 1.0519/1.1288 rally and 61.8% retracement of 1.0818/1.1288 upleg. Fresh attempts higher need penetration of 1.1288 barrier, to open next targets at 1.1387, Fibonacci 38.2% retracement of Oct 2014/Mar 2015 1.2884/1.0461 descend and key 1.1449, lower top of 19 Feb. Otherwise, extension and close below daily 10SMA, is expected to weaken structure.
Res: 1.1121; 1.1189; 1.1224; 1.1288
Sup: 1.1070; 1.1053; 1.1000; 1.0950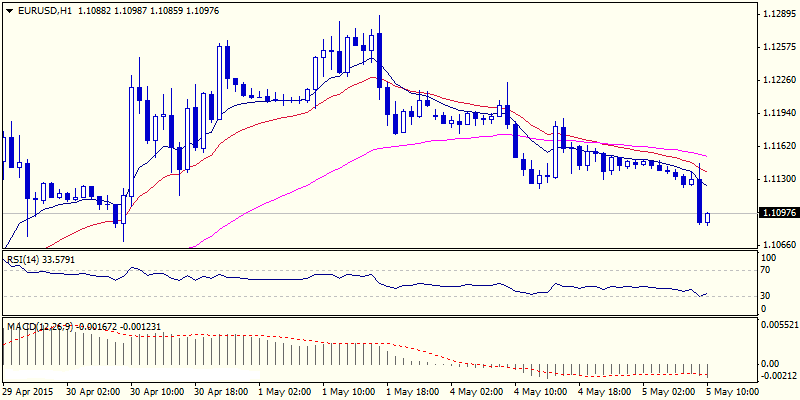
EUR/JPY
Yesterday’s close in red and today’s fresh extension lower, signal further correction of last week’s strong acceleration higher that peaked at 135.26. the move could be described as corrective action on overbought near-term studies, with ideal reversal point seen at 132.26, Fibonacci 38.2% of 127.44/135.26 upleg / daily cloud top, before fresh attempts higher. Only break here would delay overall bulls for stronger correction towards next supports at 131.76, 38.2% of 126.08/135.26 and 131.35, mid-point of 127.44/135.26 ascend.
Res: 133.70; 134.00; 134.40; 134.82
Sup: 132.26; 132.00; 131.76; 131.35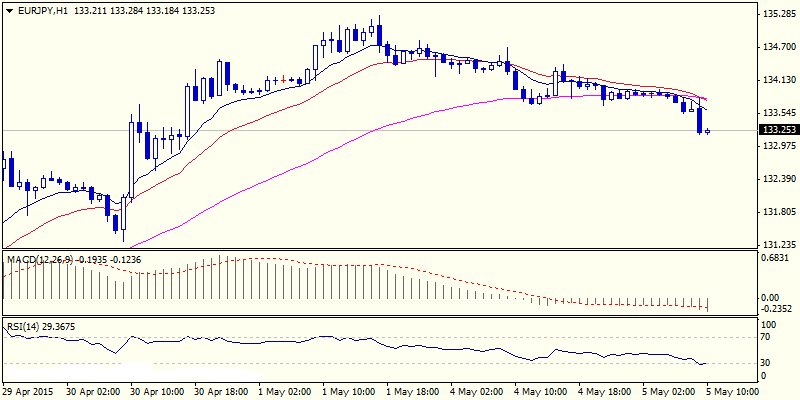
GBP/USD
The pair remains at the back foot, as yesterday’s fresh weakness ended in red again, probing below pivotal 1.51 support zone, where daily Ichimoku cloud and Fibonacci 61.8% retracement of 1.4854/1.5496 upleg lay. Temporary support was found here, with near-term consolidative phase under way. Negatively aligned near-term technicals see risk of further easing that will be looking for another pivotal support at 1.5000, psychological support, reinforced by ascending daily 20SMA, also near daily Ichimoku cloud base, loss of which to neutralize daily bulls. Current consolidation is capped by daily 100SMA at 1.5152, with break here and acceleration above 1.52, daily 10SMA, required to give initial signals of reversal.
Res: 1.5137; 1.5152; 1.5173; 1.5200
Sup: 1.5088; 1.5030; 1.5000; 1.4975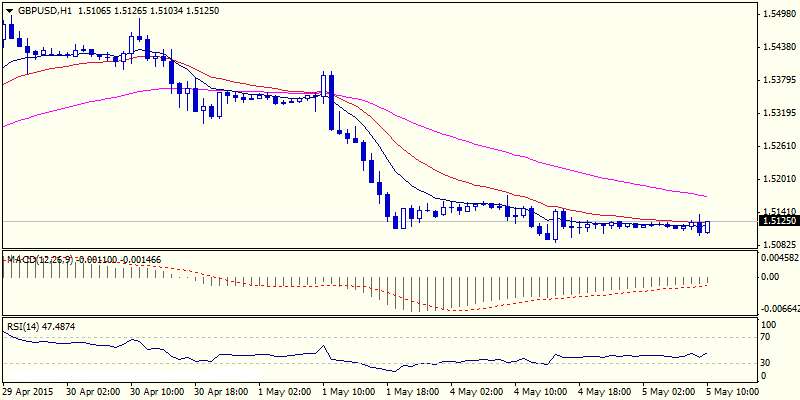
USD/JPY
The pair trades in near-term consolidative phase under yesterday’s fresh high at 120.27, with 1.20 zone, previous pivotal barrier, also daily Ichimoku cloud top, keeping the downside protected for now. Hourly neutral tone favors further sideways trading, while 4-hour studies maintain bullish setup and see scope for further ascend, after 120 breakpoint was taken out. Also, daily studies are building bullish momentum that would encourage for final push towards key barrier at 120.83, 13 Apr high and top of short-term range, final break of which is required to end short-term directionless phase and focus key peak at 122.01. Alternatively, reversal under 120 handle would risk extension to the pivotal, sideway’s moving daily 20SMA at 119.54, close below which would signal false break higher and confirm extended range-trading.
Res: 120.27; 120.46; 120.67; 120.83
Sup: 120.00; 118.80; 119.54; 119.25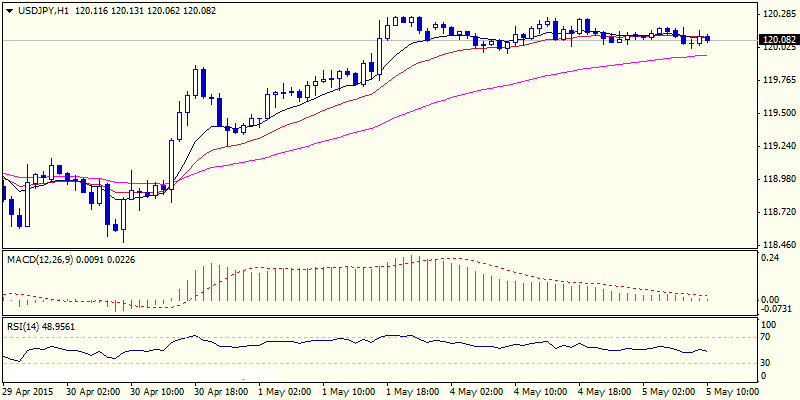
AUD/USD
The pair moves in a choppy trade after RBA’s rate cut. Yesterday’s Doji signals indecision, with hopes of reversal still in play, despite overnight’s short-lived crack of 0.78 handle that was contained by ascending daily 20SMA. Today’s rallies probed above daily Ichimoku cloud top at 0.7906, with daily close above daily 10SMA, currently at 0.7867, seen as minimum requirement to signal reversal. Extension above 0.79 barrier, to confirm. Bullish daily studies support the notion. Conversely, renewed attempts below 0.78 and loss of daily 20SMA, to confirm extension of reversal from 0.8073, peak of 29 Apr.
Res: 0.7916; 0.7961; 0.8000; 0.8020
Sup: 0.7800; 0.7780; 0.7749; 0.7738 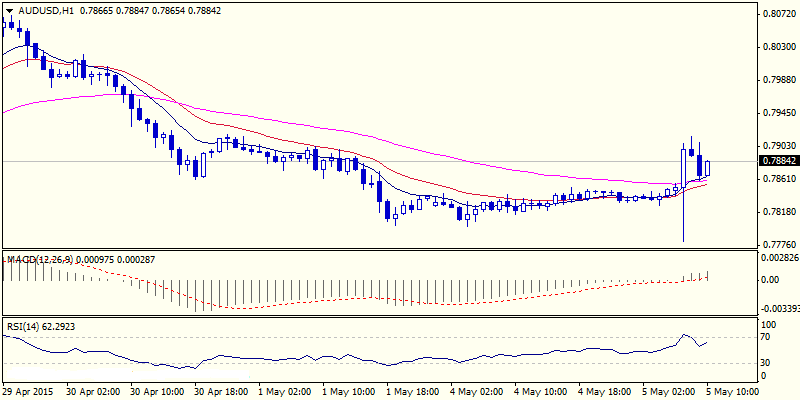
AUD/NZD
The cross jumps higher, extending above near-term narrow range consolidation, after today’s spike lower was contained at 1.0333, also previous low, reinforced by ascending daily 10SMA. Fresh rally gives initial signal of near-term base formation and completion of consolidation phase, that requires lift above fresh recovery peak at 1.0516, for eventual attack at key 1.0526, barrier, peak of 11 Mar high, to confirm completion of daily double-bottom pattern, for fresh acceleration higher. Daily studies maintain strong bullish tone and favor further upside, as the price attempts through expanding daily 20d upper Bollinger band. Near-term studies are gaining traction, with base forming at 1.0333, also Fibonacci 38.2% of 1.0033/1.0516, marking key support.
Res: 1.0493; 1.0516; 1.0526; 1.0609
Sup: 1.0420; 1.0400; 1.0380; 1.0333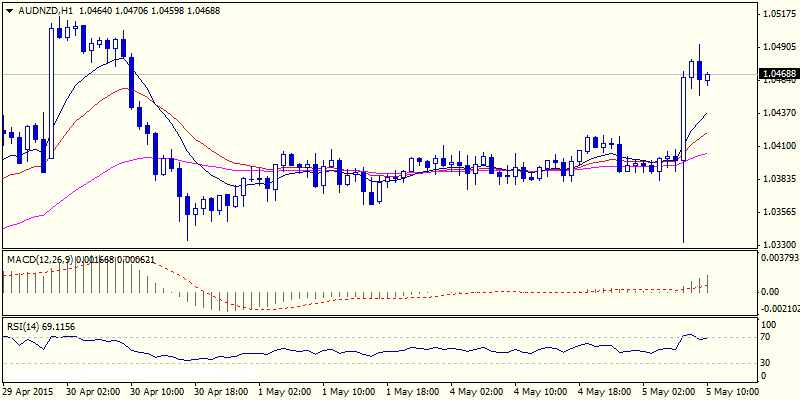
XAU/USD
Yesterday’s bounce and close above daily cloud base, sidelines immediate downside risk, seen on Friday’s spike to 1170. However, bounce that was capped by daily 10SMA / Tenkan-sen at 1192, still keeps the downside vulnerable, as larger picture bears remain intact. Unless fresh extension clears daily 20SMA at 1195 and psychological 1200 barrier that is required to neutralize downside threats and confirm extended range-trading, near-term risk will remain shifted towards the downside. Renewed attack at 1170, would signal further retracement of 1142/1224 rally.
Res: 1192; 1195; 1200; 1204
Sup: 1185; 1180; 1176; 1170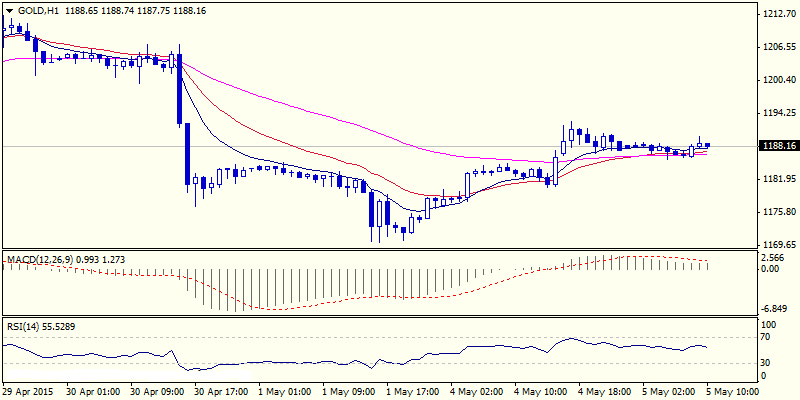
- English (UK)
- English (India)
- English (Canada)
- English (Australia)
- English (South Africa)
- English (Philippines)
- English (Nigeria)
- Deutsch
- Español (España)
- Español (México)
- Français
- Italiano
- Nederlands
- Português (Portugal)
- Polski
- Português (Brasil)
- Русский
- Türkçe
- العربية
- Ελληνικά
- Svenska
- Suomi
- עברית
- 日本語
- 한국어
- 简体中文
- 繁體中文
- Bahasa Indonesia
- Bahasa Melayu
- ไทย
- Tiếng Việt
- हिंदी
Tuesday's Daily Market Outlook: EUR/USD, EUR/JPY, GBP/USD,
Published 05/05/2015, 04:45 AM
Updated 02/21/2017, 08:25 AM
Tuesday's Daily Market Outlook: EUR/USD, EUR/JPY, GBP/USD,
Latest comments
Loading next article…
Install Our App
Risk Disclosure: Trading in financial instruments and/or cryptocurrencies involves high risks including the risk of losing some, or all, of your investment amount, and may not be suitable for all investors. Prices of cryptocurrencies are extremely volatile and may be affected by external factors such as financial, regulatory or political events. Trading on margin increases the financial risks.
Before deciding to trade in financial instrument or cryptocurrencies you should be fully informed of the risks and costs associated with trading the financial markets, carefully consider your investment objectives, level of experience, and risk appetite, and seek professional advice where needed.
Fusion Media would like to remind you that the data contained in this website is not necessarily real-time nor accurate. The data and prices on the website are not necessarily provided by any market or exchange, but may be provided by market makers, and so prices may not be accurate and may differ from the actual price at any given market, meaning prices are indicative and not appropriate for trading purposes. Fusion Media and any provider of the data contained in this website will not accept liability for any loss or damage as a result of your trading, or your reliance on the information contained within this website.
It is prohibited to use, store, reproduce, display, modify, transmit or distribute the data contained in this website without the explicit prior written permission of Fusion Media and/or the data provider. All intellectual property rights are reserved by the providers and/or the exchange providing the data contained in this website.
Fusion Media may be compensated by the advertisers that appear on the website, based on your interaction with the advertisements or advertisers.
© 2007-2025 - Fusion Media Limited. All Rights Reserved.
