Market Snapshot:
ECONOMY: With China Flash PMI below 50 and a 7 month low it will weigh down on the global economy and set a risk-off sentiment.
AUD: The Australian Dollar sold off across the board following today's disappointing PMI data.
CAD: Canadian Dollar is looking increasingly weak and back in line with our bearish views. The weekly charts are within a well-defined downtrend with the daily now aligning with it across the board.
CHF: On back of the recent woes Swissy has enjoyed the usual flight to safety to see USDCHF at weekly lows.
JPY: Trade balance came in less than expected to see exports at a record low.
EUR: French and German Flash PMI's out later - German manufacturing has been expanding for 6 months and has a consensus of 56.4 whilst France has been contracting but showing signs of improvement the past 2 months with increased manufacturing. However consensus is 46.60 so above 50 could be very bullish for EUR and European Equities.
NZD: PPI input and output both came in less than the consensus at their lowest levels in 5 months.
USD: The FED is determined to continue tapering at 10bn per month despite opposition from those who are concerned it is too soon. USD Index continues to trade around the weekly lows.
CHARTS OF THE DAY:
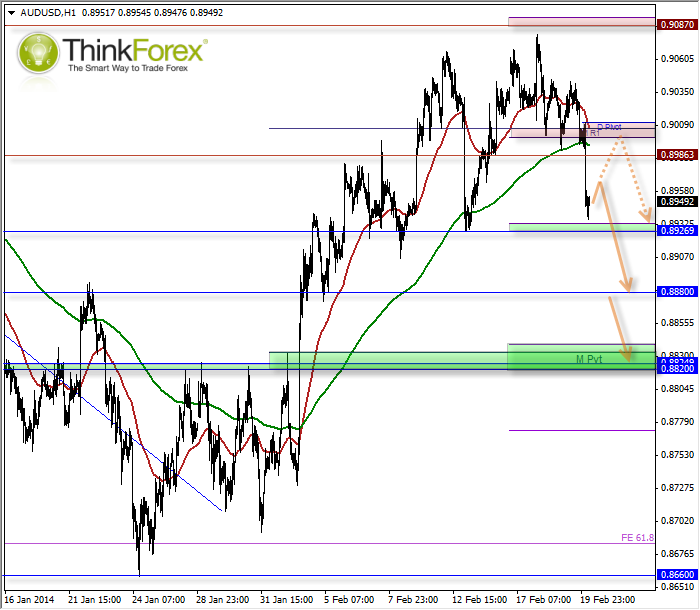
AUD/USD: Back below 0.90 and in line with larger trends
 AUD/USD" title="AUD/USD" height="242" width="474">
Prior to today’s declines my bias was to remain below 0.908 simply because, despite positive news over the past few weeks for AUD, and negative for USD, it still failed to capitalise on the occasion and break 0.908 level. All it required was a little push of negativity, and today's Chinese PMI certainly delivered that. Whilst [rice is resting above 0.9830 support we await for London and New York to open to see how they react.
Back to the technicals…
In the event we see any retracements I doubt we will see it recover back up to 0.90, but this is a god resistance area to consider to hide stops above. My bias is for continued losses and to target 0.8820, so any retracements towards 0.8930 may be seen as a 'better price to get short'.
Only a break above 0.90 invalidates this analysis, with a break above 0.908 required to bring the bearish picture on the daily chart under question.
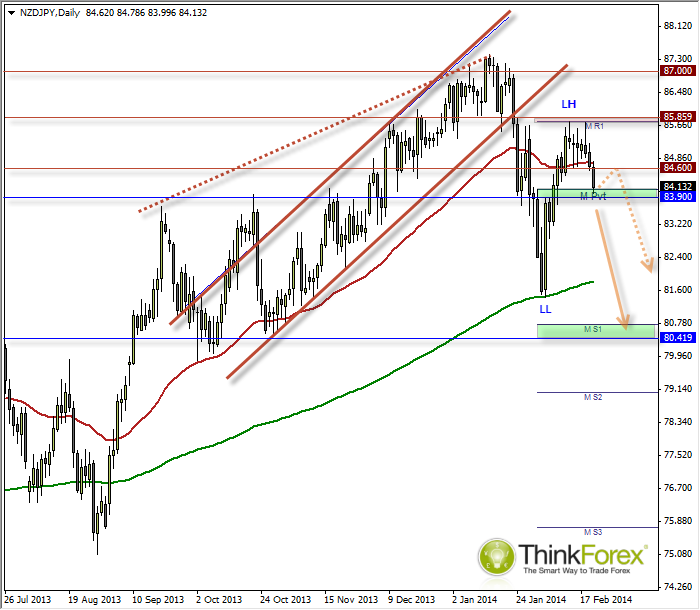
NZD/JPY: Looking increasingly weak below 85.8
 NZD/JPY" title="NZD/JPY" height="242" width="474">
While the bullish advance from the 200eMA around 81.60 quickly recouped losses from the bearish channel breakout, due to the weakening of NZD in other markets and weak Chinese PMI data today I suspect NZD/JPY may be overbought and due another drop.
The 85.86 resistance area capped any gains and now formed a suspected lower high which would require a new lower low. The next logical target on the daily timeframe would be around 80.50 with only the 200eMA as a potential part-stopper of any declines.

