
USD/MXN continues to rise after the recent completion of the high quality falling wedge chart pattern identified by Autochartist on the daily charts. The overall quality of this chart pattern is measured at the 8-bar level, which reflects the stronginitial trend (rated at the maximum 10-bar level), average uniformity (5 bars) and higher clarity (6 bars). The completion of this falling wedge continues the prevailing uptrend that can be seen on the daily USD/MXN charts. The bottom of this falling wedge (point E below) formed when the pair reversed up from the strong support area made out of the round price level 13.00 and the upward support trendline from July of last year. The pair is expected to rise further toward the forecast price 13.9279.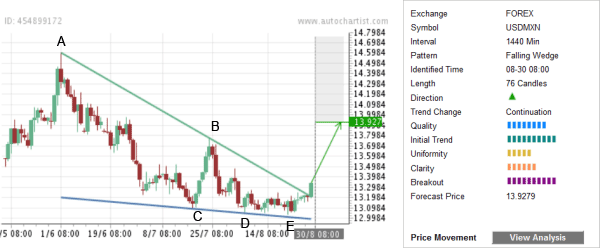 USD/MXN" title="Dailyfx 1" width="600" height="248">
As can be seen from the PowerStats chart below, all of the daily expected price range for USD/MXN (from 13.2642 to 13.5228) stands above the broken resistance trendline of the above falling wedge, which adds to the probability that this currency pair will rise further.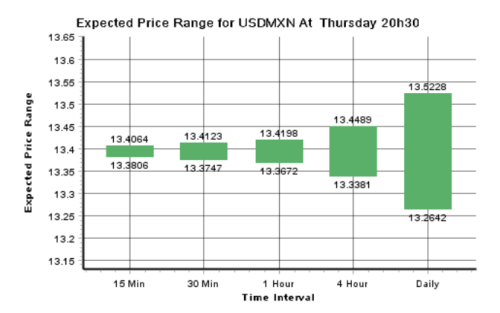 USD/MXN Price Range" title="Dailyfx 2" width="500" height="313">
The weekly USD/MXN chart below shows the longer-term picture of this currency pair’s movement: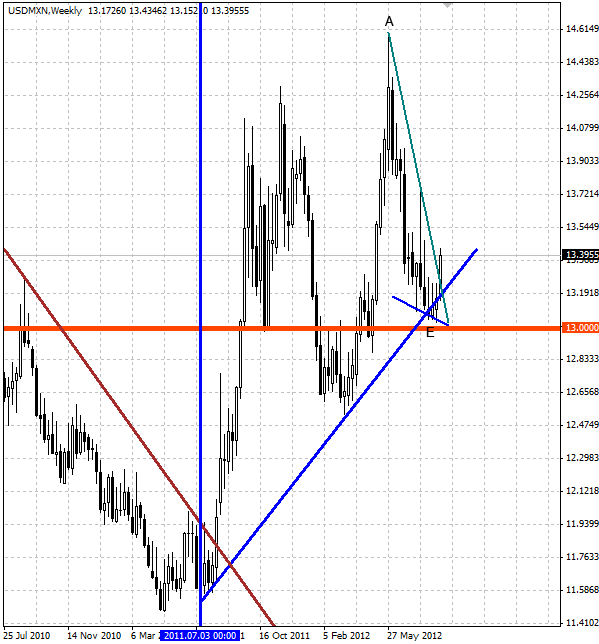 USD/MXN Weekly" title="Dailyfx 3" width="599" height="644">
- English (UK)
- English (India)
- English (Canada)
- English (Australia)
- English (South Africa)
- English (Philippines)
- English (Nigeria)
- Deutsch
- Español (España)
- Español (México)
- Français
- Italiano
- Nederlands
- Português (Portugal)
- Polski
- Português (Brasil)
- Русский
- Türkçe
- العربية
- Ελληνικά
- Svenska
- Suomi
- עברית
- 日本語
- 한국어
- 简体中文
- 繁體中文
- Bahasa Indonesia
- Bahasa Melayu
- ไทย
- Tiếng Việt
- हिंदी
Daily FX: USD/MXN
Latest comments
Loading next article…
Install Our App
Risk Disclosure: Trading in financial instruments and/or cryptocurrencies involves high risks including the risk of losing some, or all, of your investment amount, and may not be suitable for all investors. Prices of cryptocurrencies are extremely volatile and may be affected by external factors such as financial, regulatory or political events. Trading on margin increases the financial risks.
Before deciding to trade in financial instrument or cryptocurrencies you should be fully informed of the risks and costs associated with trading the financial markets, carefully consider your investment objectives, level of experience, and risk appetite, and seek professional advice where needed.
Fusion Media would like to remind you that the data contained in this website is not necessarily real-time nor accurate. The data and prices on the website are not necessarily provided by any market or exchange, but may be provided by market makers, and so prices may not be accurate and may differ from the actual price at any given market, meaning prices are indicative and not appropriate for trading purposes. Fusion Media and any provider of the data contained in this website will not accept liability for any loss or damage as a result of your trading, or your reliance on the information contained within this website.
It is prohibited to use, store, reproduce, display, modify, transmit or distribute the data contained in this website without the explicit prior written permission of Fusion Media and/or the data provider. All intellectual property rights are reserved by the providers and/or the exchange providing the data contained in this website.
Fusion Media may be compensated by the advertisers that appear on the website, based on your interaction with the advertisements or advertisers.
© 2007-2024 - Fusion Media Limited. All Rights Reserved.